Last week the movement of the stock market was overtaken by the elections in the United States and the narrow margin in votes that they had in some States. However, at www.elliottwave-forecast.com we ignore the noise and focus on our Elliott Wave trading system and technical analysis. What happened with the actions of Nike ($NKE) shares is a proof of that. Before the elections, the structure of Nike told us that we were going to have at least one bounce in 3, 7 or 11 swings, so we put the blue box in position knowing it would do its job in favor of the right side of the market.
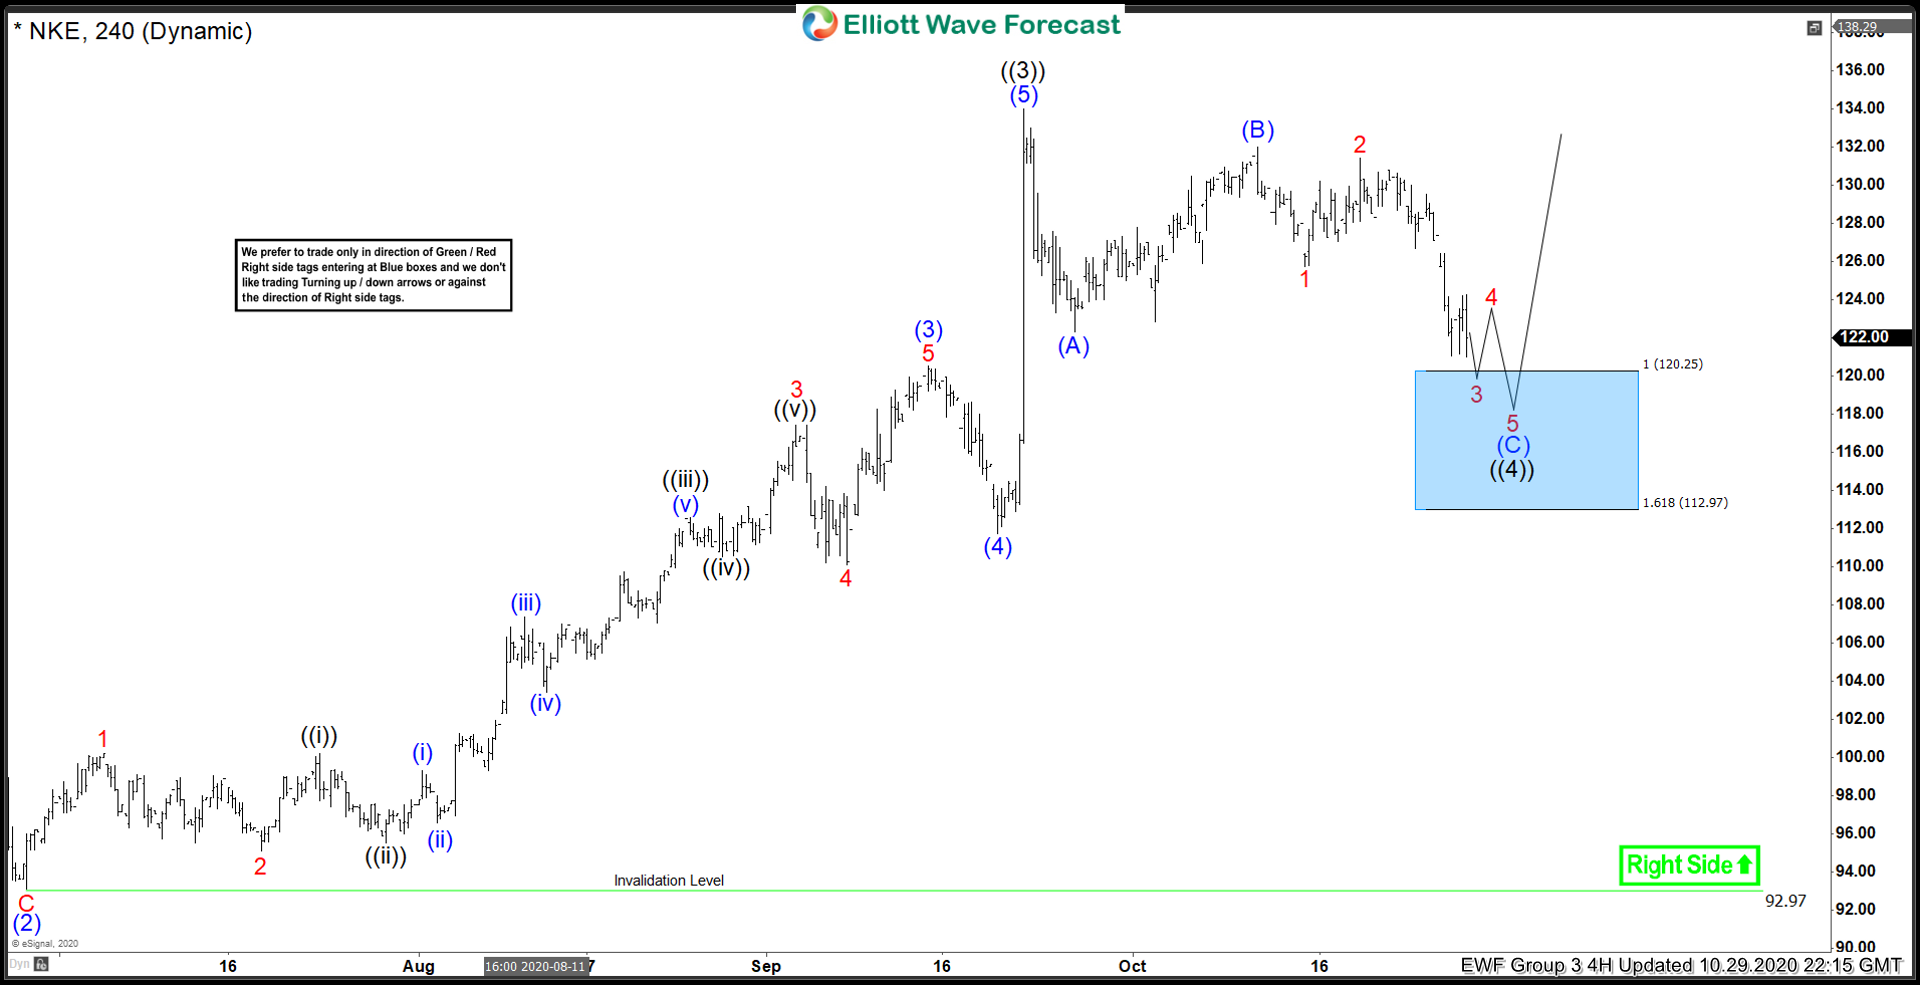
Placing the Blue Box in the $NKE 4-hour chart present on Oct 29th, 2020
As we said the structure was clear. After completing the wave ((3)) in $NKE, we had two waves (A) and (B), where (B) got quite close to the start of wave (A) and continued the downward movement very strong. This indicated a high probability that the structure that was forming a flat correction. (For more details on what a flat correction in Elliott waves means, please visit this link: Flat Corrections). So taking lentghs of wave (A) and wave (B) we place the blue box, which is the area where we must see a counter reaction in at least 3 swings in a corrective way, and even better if the rebound was in the same direction of the right side of the market, mark that we can see it in green in the lower right part of the chart.
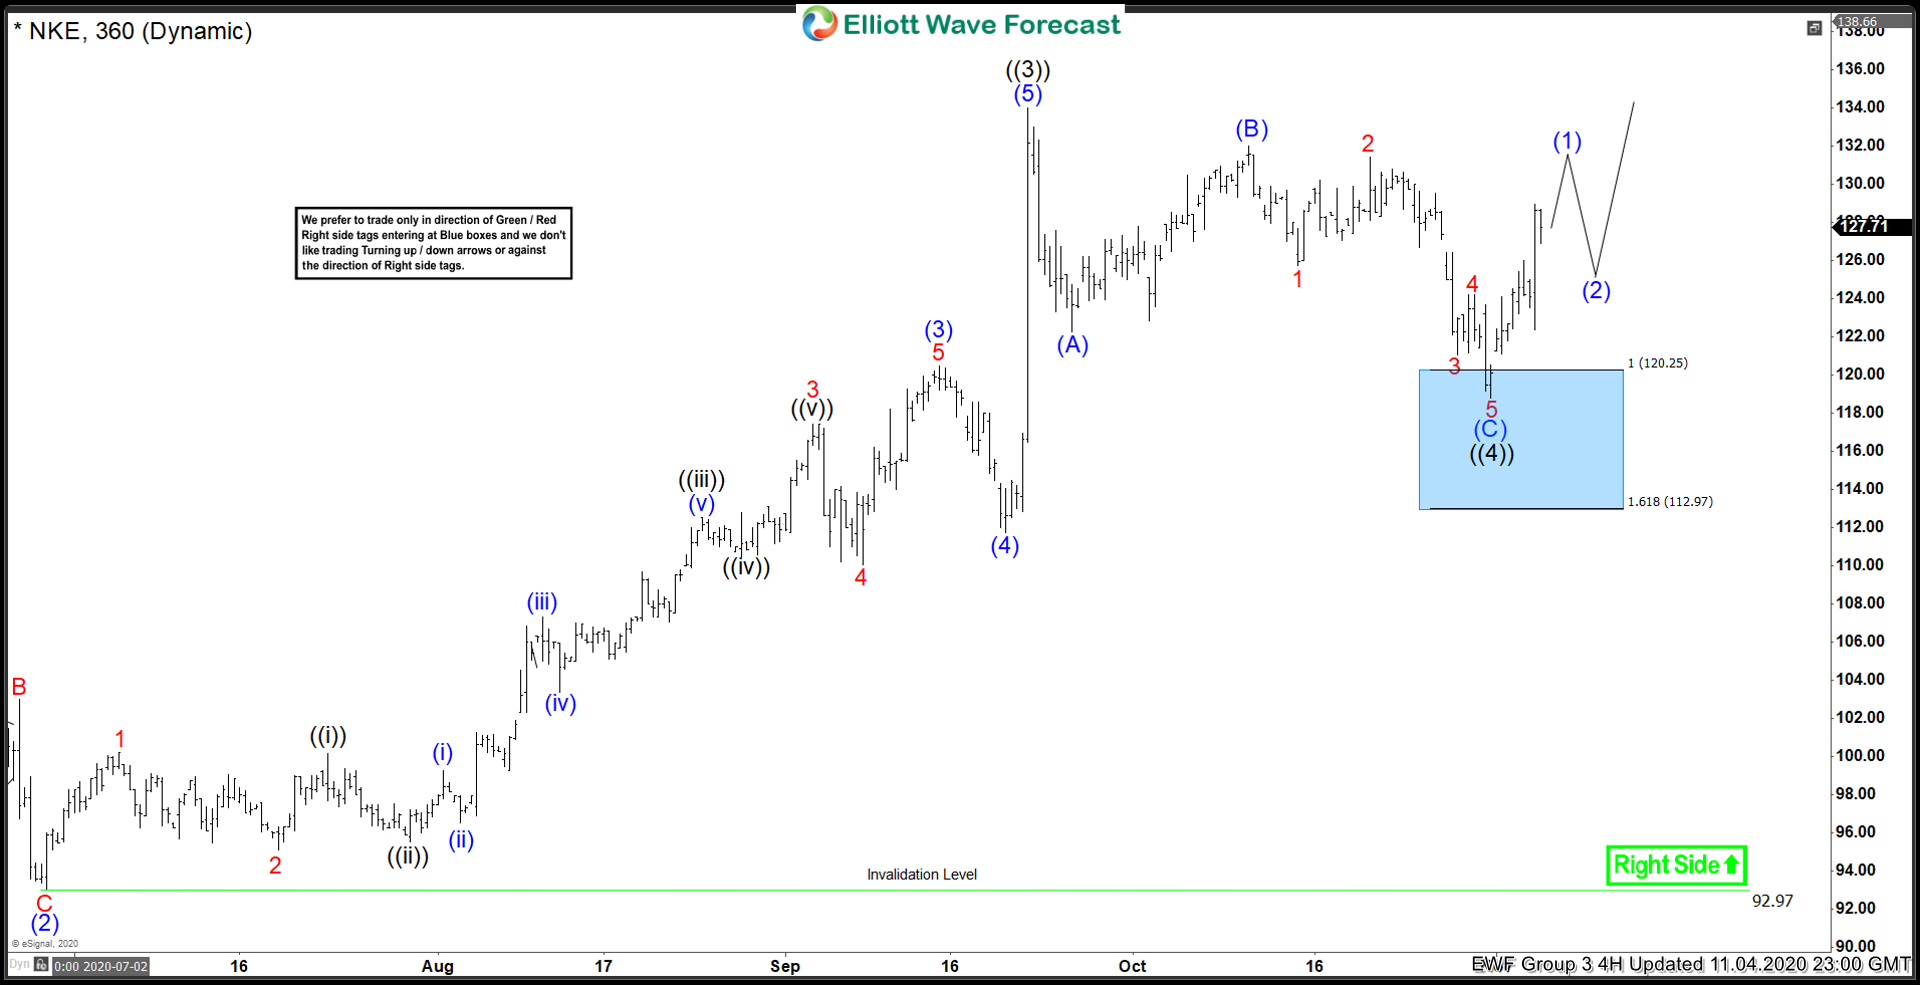
$NKE 4-hour chart shown after the US Elections.
As we can see in the following chart, the $NKE reached the blue box and bounced, we placed the wave ((4)) analyzing the market as a whole and looking at the structures of instruments such as the $SPX and the $UKX-FTSE which showed that a bullish continuation was most likely and we looked to continue in the same direction with Nike. Currently, the instrument has already made 3 swings to the upside which was what at least we expected to happen and we will keep informed in our members area, if we will finally break the wave ((3)) or we will make a double correction as wave ((4)).
In Elliottwave Forecast we update the one-hour charts 4 times a day and the 4-hour charts once a day for all our 78 instruments and also the blue boxes and rigth side mark. We do a daily live session where we guide our clients on the right side of the market. In addition, we have a chat room where our moderators will help you with any questions you have about what is happening in the market at the moment.