Asian indices were quick to rally out of the gate on Monday after a strong lead from Wall Street, sending Nikkei futures 1% higher. Gold looks worse for wear and we eye a potential move down to $2300.
By :Matt Simpson, Market Analyst
Asian share markets were buoyant on Monday on refreshed hopes that central banks will be better placed to cut rates this year. While a key US inflation report on Friday saw the headline figures come in as expected, real spending was -0.1% lower and a print of core PCE of 0.2% m/m was its slowest rate of inflation since November. I wouldn’t go as far as to say the Fed’s fight against inflation is over, but it was enough to boost appetite for risk and send the US dollar lower.
APAC index futures were mostly higher on Monday, with the Hang Seng, Nikkei, TOPIX, and KOPSPI all rising over 1%. With the ECB fully expected to cut rates for the first time in eight years this week, and the potential for the BOC to also cut rates on the table, this has certainly boosted sentiment. However, for these reactions to sustain their advance and for Wall Street to break to new highs, we will likely need to see some weak numbers from the ISM and NFP reports this week.
S&P 500, Nasdaq 100, Dow Jones futures chart:

The S&P 500 rose 0.8% and formed a prominent bullish outside, the Dow Jones snapped a 6-day losing streak and the Nasdaq 100 recouped earlier losses to close back above the March high with a bullish pinbar. It remains debatable as to whether Wall Street can simply break to new highs, but it clearly shows that bulls are not ready to throw in the towel just yet.
Click the website link below to get our exclusive Guide to index trading in Q2 2024.

Nikkei 225 technical analysis:
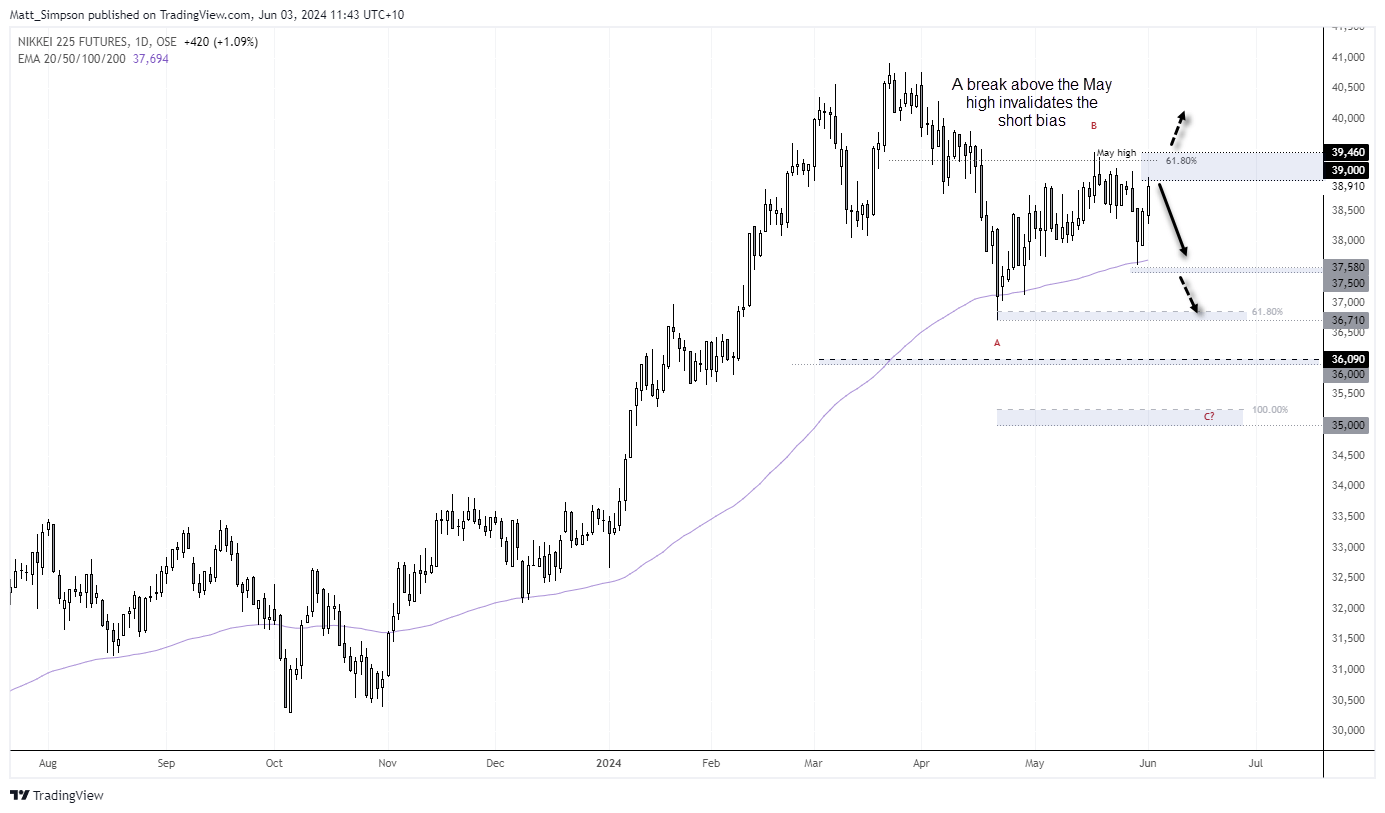
Last week I outlined a bearish scenario for the Nikkei with potential downside targets at 37k and 35k, but if Wall Street indices continue to bounce with risk, then the short bias becomes invalidated with a break above the May high (39,460).
For now, I will stick to my guns and view the current rally as an optimistic knee-jerk reaction to Friday’s PCE data. Because if ISM and NFP produce semi-decent figures, it remains hard to justify an overly-dovish Fed.
The daily chart shows the Nikkei is likely to close higher for a second day after finding support at the 100-day EMA. If confident that US data will remain firm, bears may seek to enter around current levels with a stop above the May high. This keeps the reward-to-risk ratio favorable for bears with a clear line in the sand to abort should momentum rip higher.
Gold technical analysis:
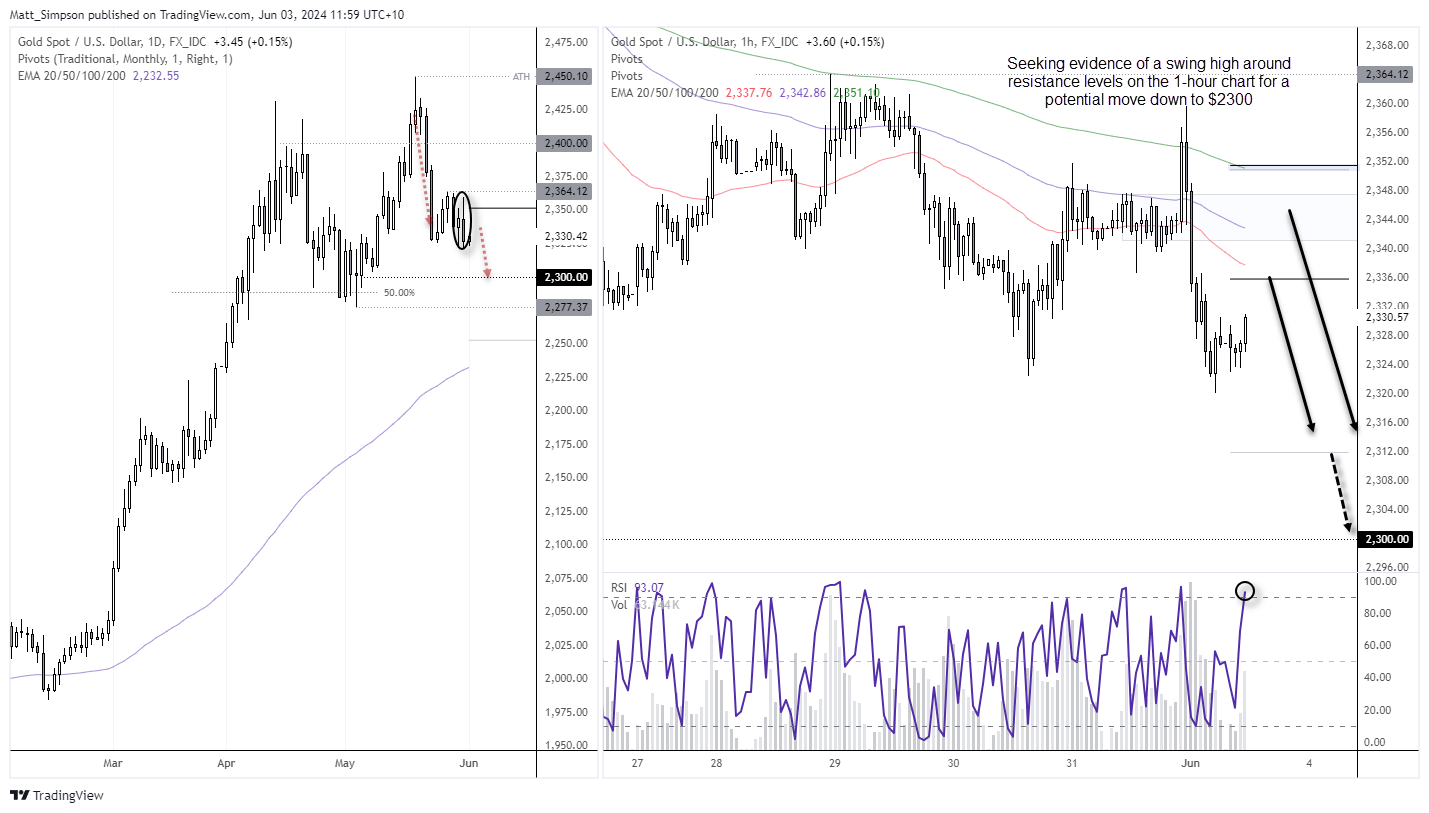
Spot gold prices have effectively remained within a $33 range since they fell -4% over two weeks ago. And I suspect they could break out of that range this week, given the economic calendar. While fundamentals are likely to continue supporting gold overall, I am not yet convinced we have seen the end of the move lower from its recent record high.
The strong fall from the all-time high set in May has had time to pause for breath, so my bias is for at least one more dip lower.
Click the website link below to get our exclusive Guide to gold trading in Q2 2024.

The daily chart shows that a bearish engulfing candle formed on Friday, and its high failed to retest the highs around $2365. The bias is to fade into minor rallies within Friday’s range with a view for spot prices to retest $2300.
The 1-hour chart shows momentum is turning higher, and I am now patiently waiting for evidence of a swing high (and lower high) to form around a resistance level. Areas to consider could include the weekly pivot point ($2336), the previous consolidation ($2340/50), or the monthly pivot, near the weekly R1 pivot and 200-bar EMA.
– Written by Matt Simpson
Follow Matt on Twitter @cLeverEdge
From time to time, StoneX Financial Pty Ltd (“we”, “our”) website may contain links to other sites and/or resources provided by third parties. These links and/or resources are provided for your information only and we have no control over the contents of those materials, and in no way endorse their content. Any analysis, opinion, commentary or research-based material on our website is for information and educational purposes only and is not, in any circumstances, intended to be an offer, recommendation or solicitation to buy or sell. You should always seek independent advice as to your suitability to speculate in any related markets and your ability to assume the associated risks, if you are at all unsure. No representation or warranty is made, express or implied, that the materials on our website are complete or accurate. We are not under any obligation to update any such material.
As such, we (and/or our associated companies) will not be responsible or liable for any loss or damage incurred by you or any third party arising out of, or in connection with, any use of the information on our website (other than with regards to any duty or liability that we are unable to limit or exclude by law or under the applicable regulatory system) and any such liability is hereby expressly disclaimed.