Hello fellow traders. NIKKEI has been very technical recently. The Futures was keep finding buyers at the Equal legs- Blue Box areas. We’re going to take a quick look at the Elliott Wave charts of NIKKEI published in the membership area of the elliottwave-forecast .
NIKKEI ended cycle from the 22427 low as 5 waves structure. We got 3 waves pull back , when the price reached Equal Legs – Blue Box at 23155-22888. NIKKEI found buyers at that area as we expected, but later on, market decided to take less aggressive view. In further text we’re going to explain Elliott Wave Forecast.
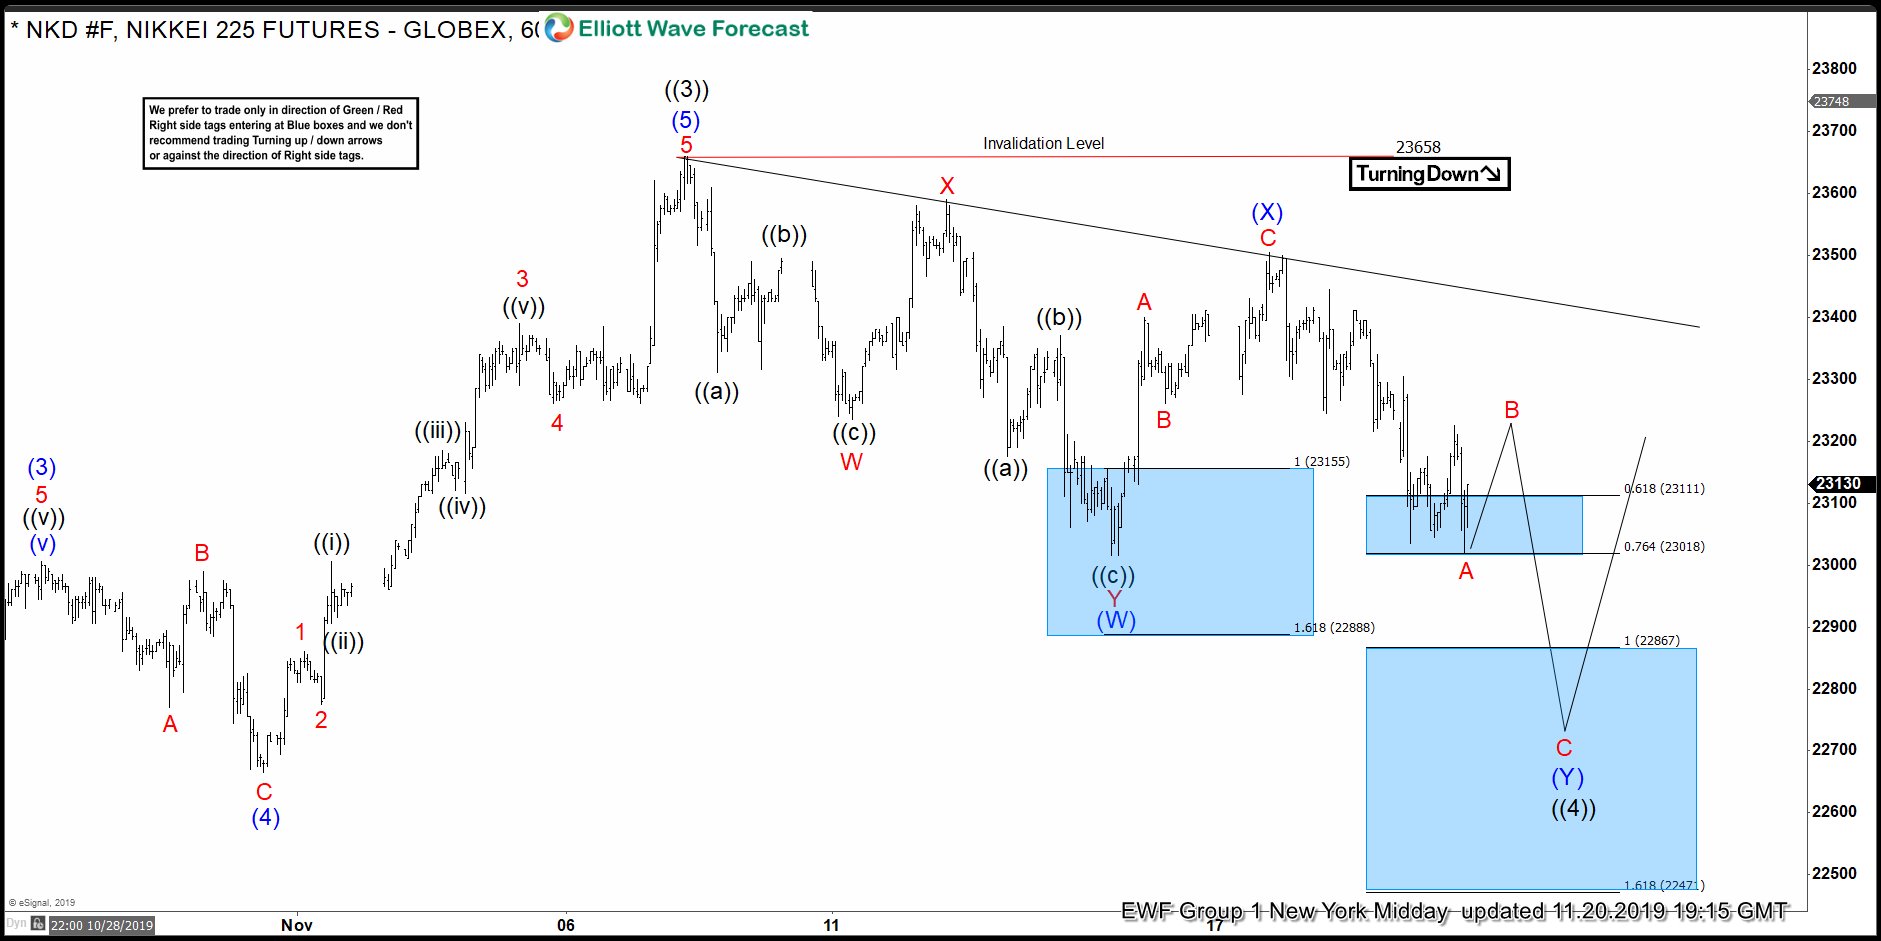
NIKKEI 1 Hour Elliott Wave Analysis 11.20.2019
Current view suggests NIKKEI can be still correcting the cycle from the 22427 low. Cycle from the 11/14 low ended as truncation , labeled as wave (X) blue on the chart. As of right now we see 3 swings down from the peak WXY red. However as the current decline from the (X) blue peak looks too deep, we are calling for Double pull back in wave ((4)). We believe that wave ((4)) pull back can be still unfolding as 7 swings pattern toward 22867-22471. That area is next set of equal legs from the 23658 peak, (W) relater to (X). We expect buyers to appear there again, either for further rally or 3 waves bounce alternatively.
As our members know, Blue Boxes are no enemy areas , giving us 85% chance to get a reaction from there. We advise members to avoid selling against the main bullish trend and expect rally to happen from the blue box in 3 waves bounce at least.
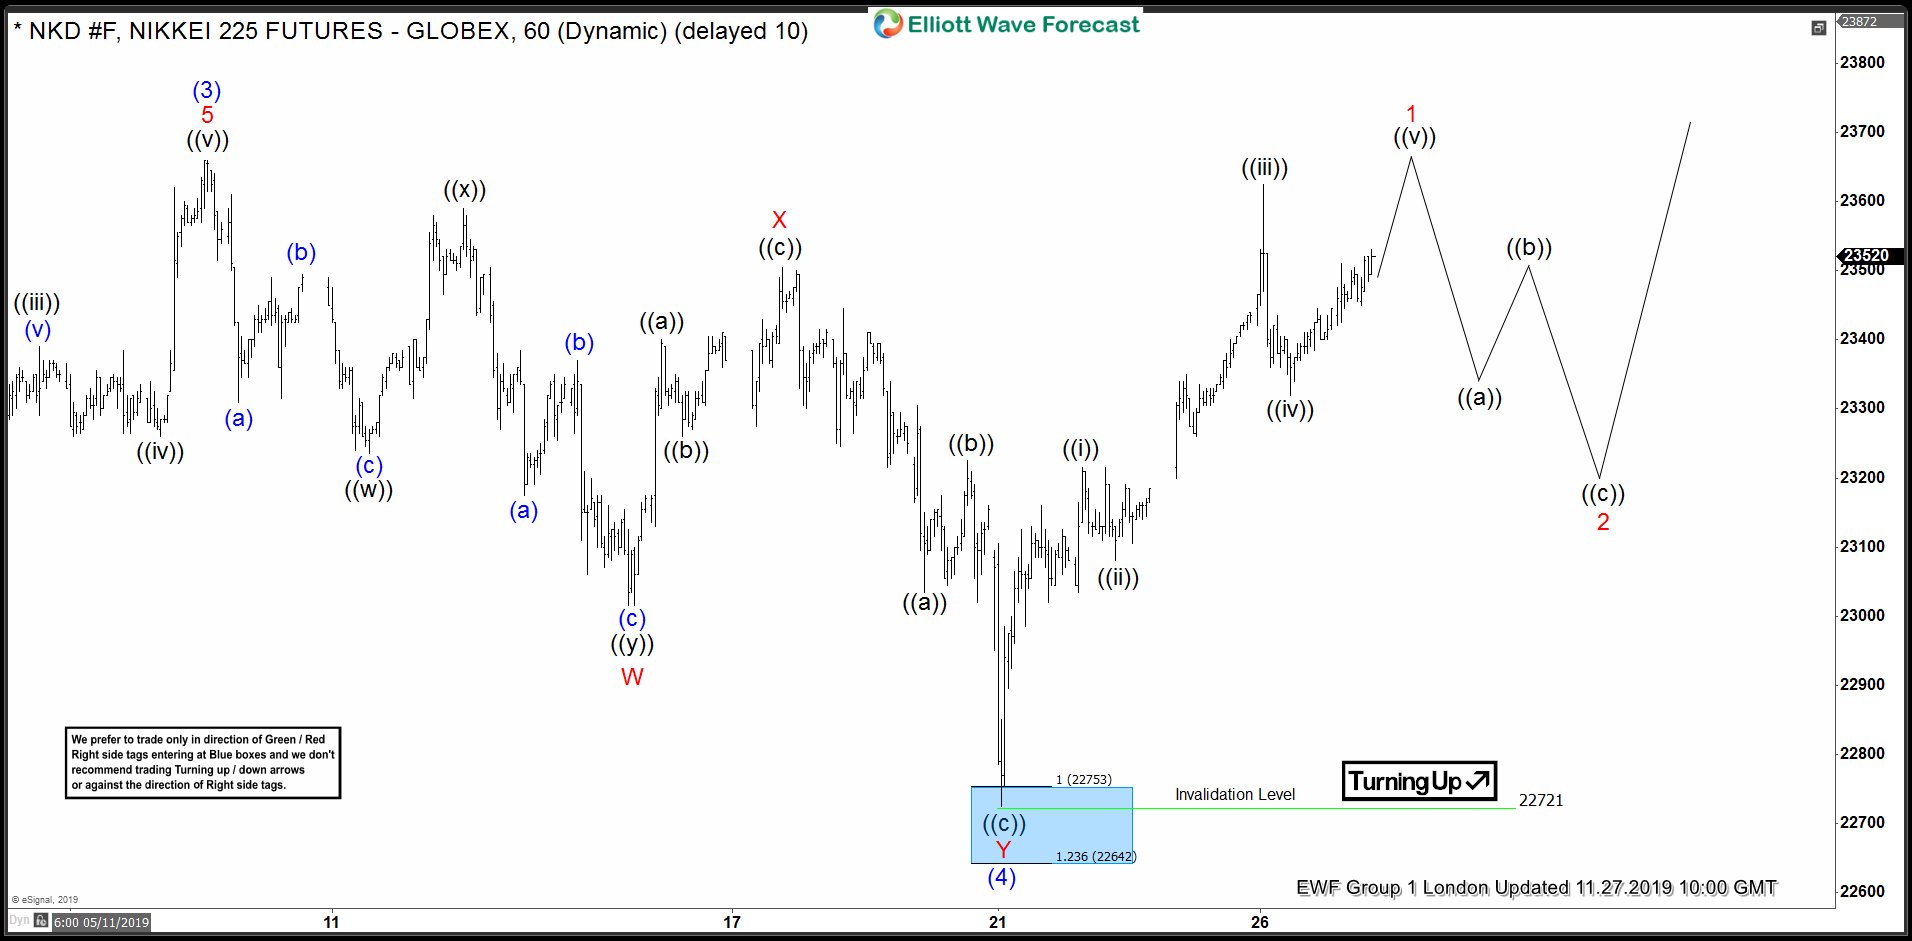
NIKKEI 1 Hour Elliott Wave Analysis 11.27.2019
NIKKEI Futures found buyers at the blue box area as expected. We got nice rally from there and we are calling wave (4) blue pull back completed at 22721. Now, we would like to see further extension higher and break above 11/07 high to confirm next leg up is in progress. Nikkei is not recommended for selling in any proposed pull back, and would like to see proposed break before buying short term dips against the 22721 low.
Keep in mind market is dynamic and presented view could have changed in the mean time. You can check most recent charts in the membership area of the site. Best instruments to trade are those having incomplete bullish or bearish swings sequences.We put them in Sequence Report and best among them are shown in the Live Trading Room.