In this technical blog, we will look at the past performance of 1-hour Elliott Wave Charts of NVDA. In which, the decline from 05 August 2022 high is unfolding as an impulse sequence and showed a lower low sequence within the bigger cycle from November 2021 peak. Therefore, we knew that the structure in NVDA is incomplete to the downside & should see more weakness. So, we advised members to sell the bounces in 3, 7, or 11 swings at the blue box areas. We will explain the structure & forecast below:
NVDA 1 Hour Elliott Wave Chart
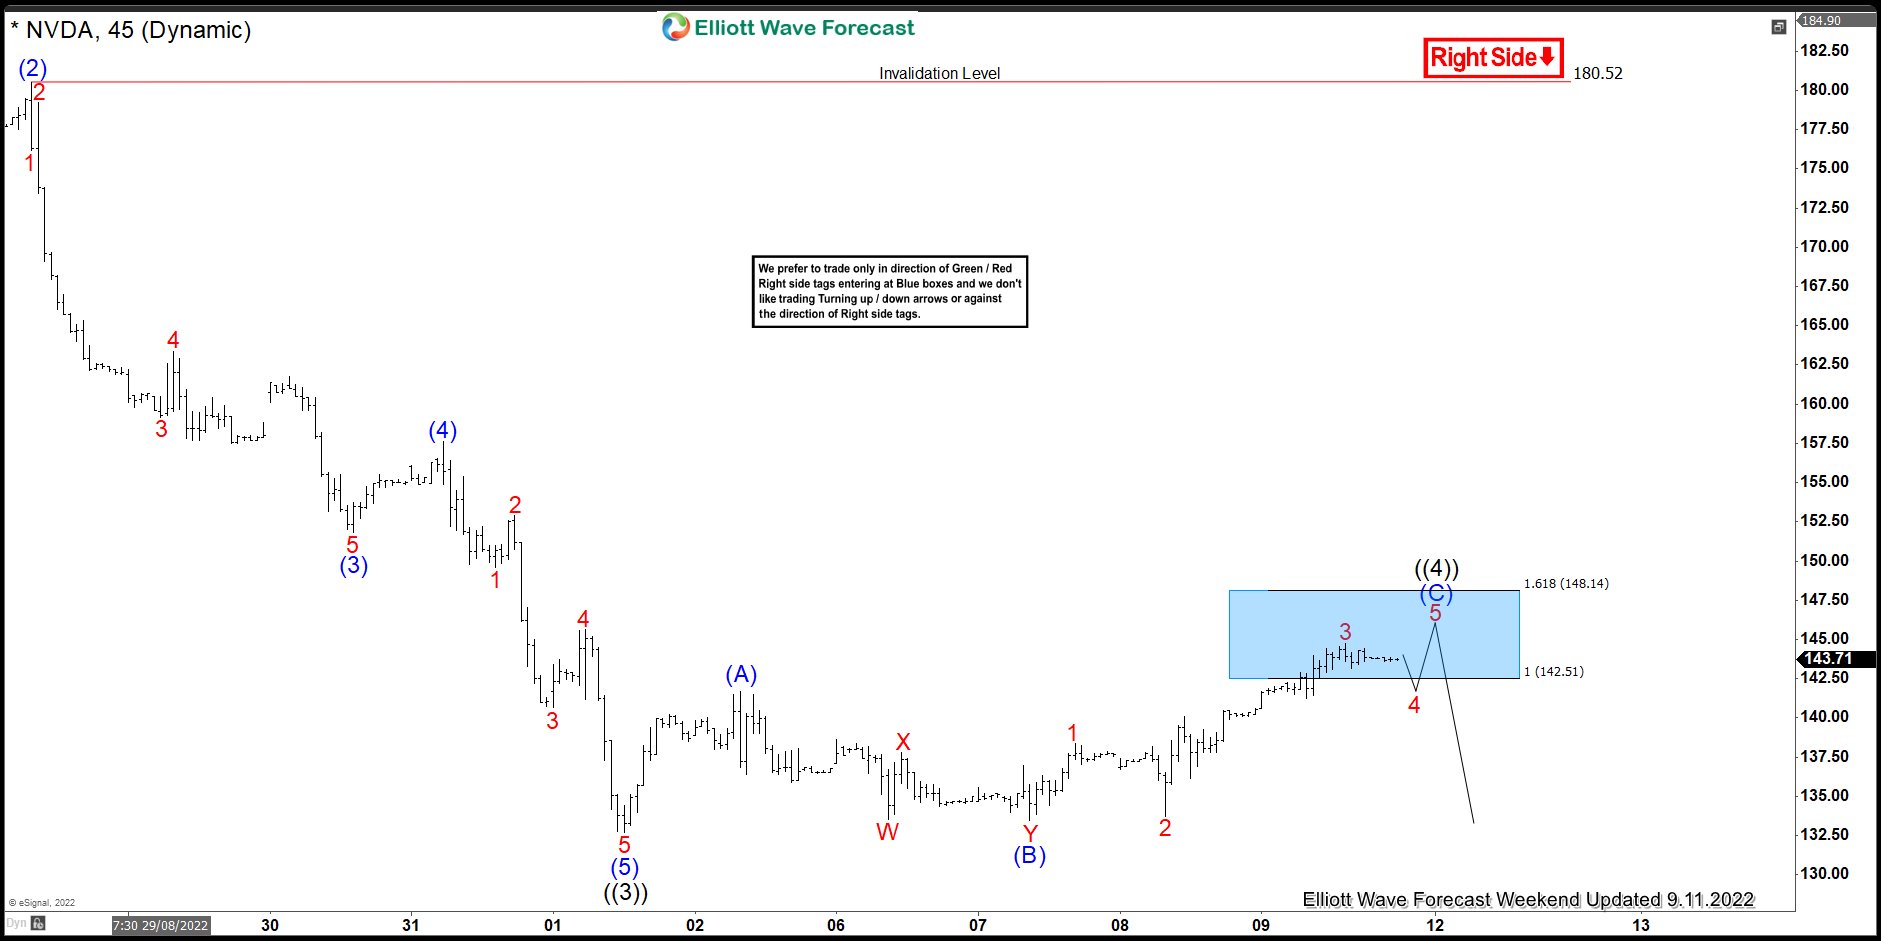
Here’s 1hr Elliott wave Chart from the 9/11/2022 Weekend update. In which, the decline to $132.76 low ended 5 waves from 8/26/2022 high in wave ((3)) & made a bounce in wave ((4)). The internals of that bounce unfolded as an Elliott wave zigzag correction where wave (A) ended at $141.71 high. Then a pullback to $133.46 low ended wave (B) pullback and started the (C) leg higher towards $142.51- $148.14 blue box area from where sellers were expected to appear looking for more downside or for a 3 wave reaction lower at least.
NVDA Latest 1 Hour Elliott Wave Chart
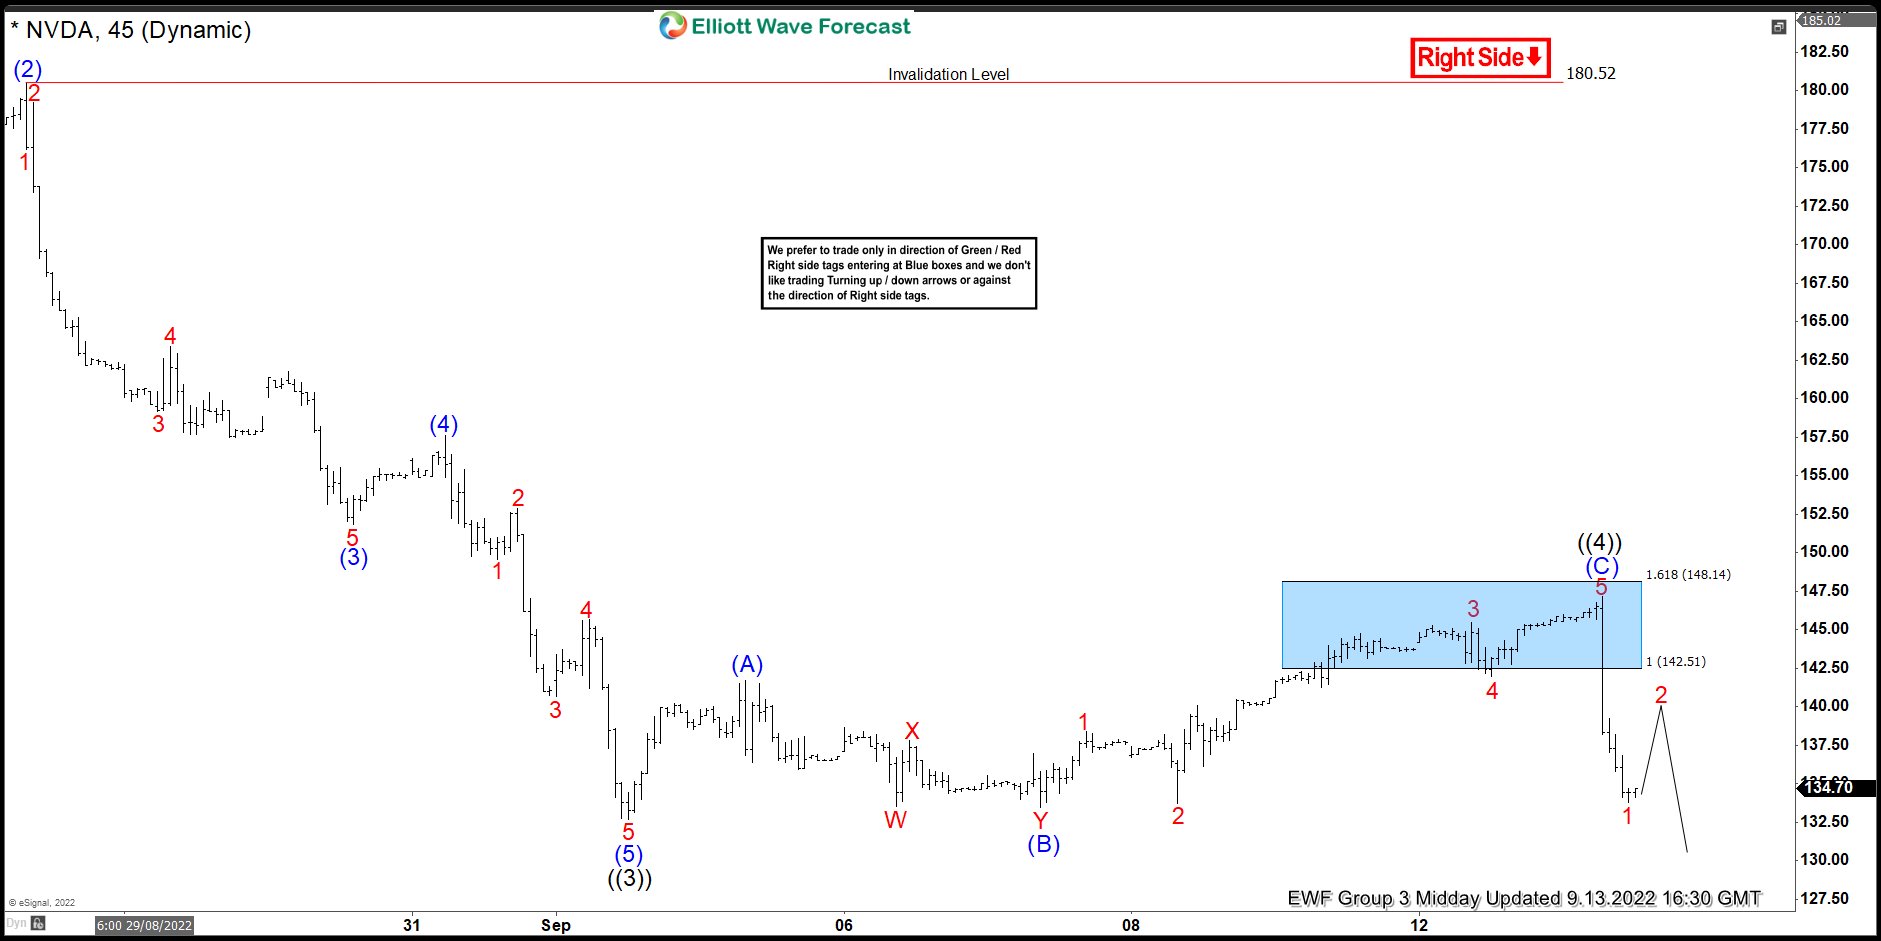
This is the Latest 1hr view from the 9/19/2022 Midday update. In which the stock is showing a reaction lower taking place from the blue box area allowing shorts to get into a risk-free position shortly after taking the position. Currently, the stock has already made a new low confirming the next extension lower towards $129.16- $123.54 area lower minimum before a bounce happens.