Nvidia (NASDAQ: NVDA) is up 25% Year-To-Date outperforming the Semiconductor Sector which is currently down 9%. Despite, the sell off that took place last month around the entire stock market, NVDA along few other stocks managed to sustain its main bullish trend because it was trading within a powerful wave ((III)) as mentioned in our previous article earlier this year.
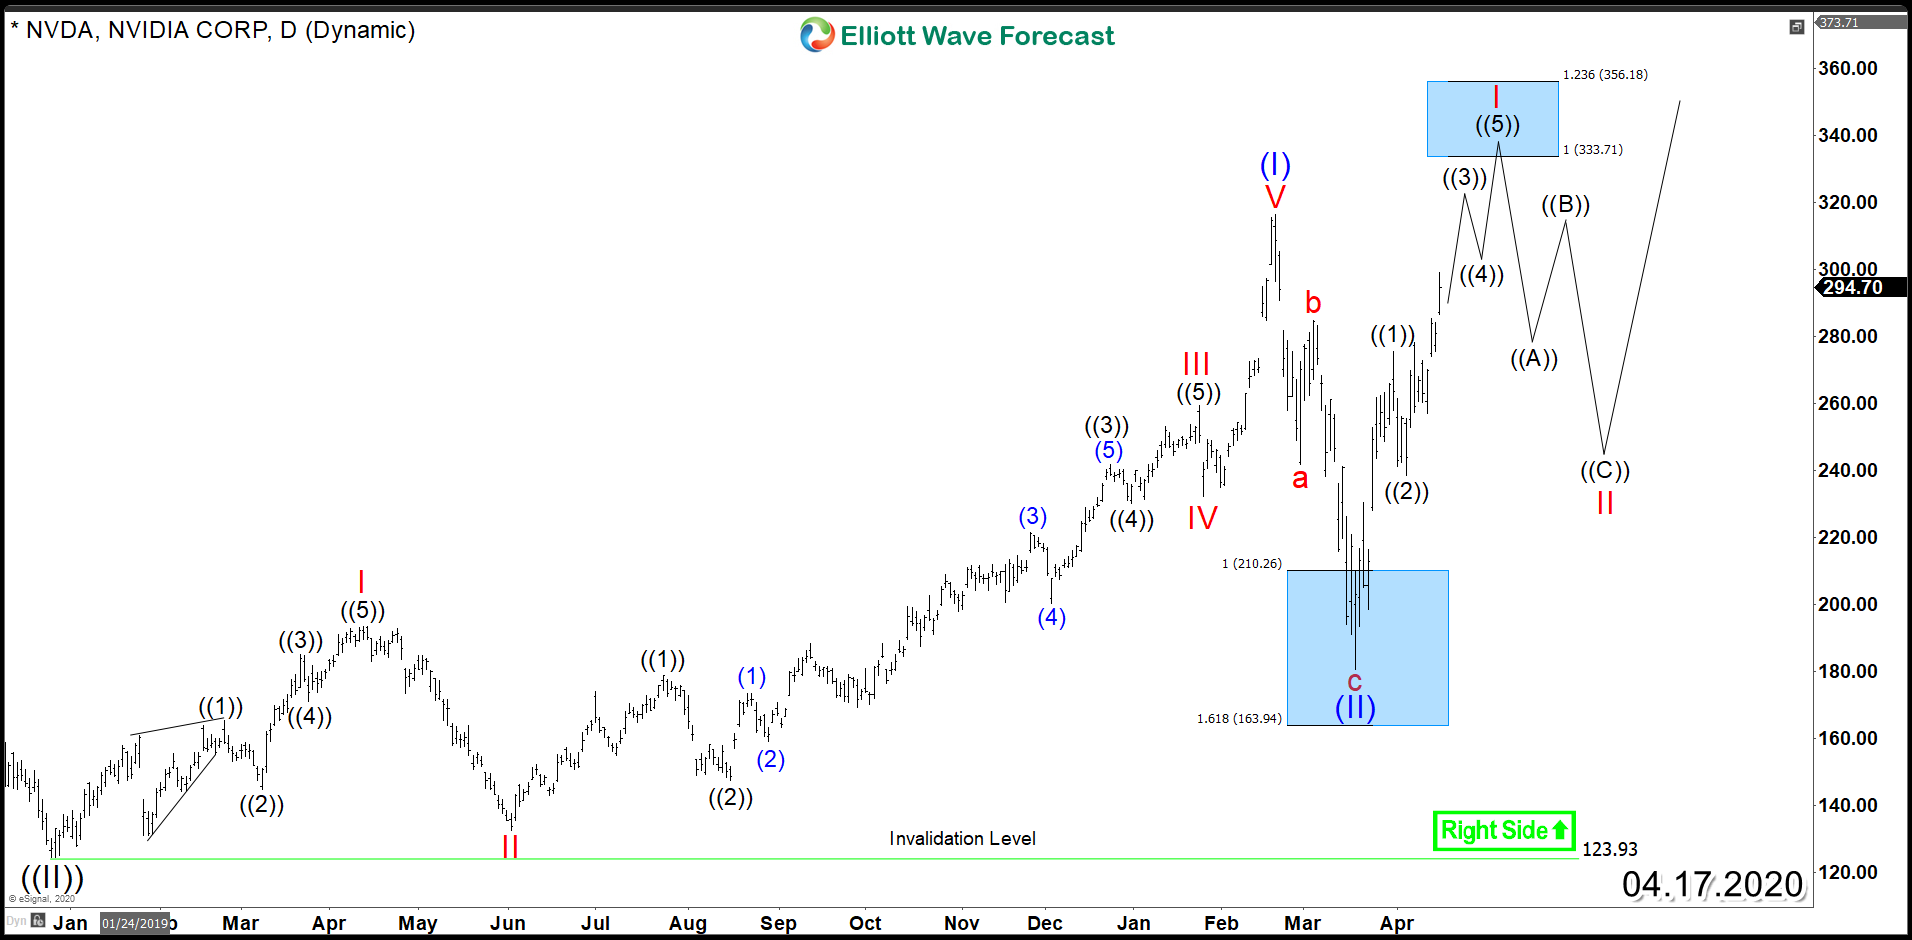
The stock rallied higher earlier this year breaking above 2018 peak which created the incomplete bullish sequence from all time lows suggesting that NVDA will remain supported during pullbacks in 3 , 7 or 11 swings and will be looking for a minimum target higher around $415 area. The rally from December 2018 low $123 ended at February 2020 peak $317, down from there, 3 waves Zigzag structure took place into the extreme blue box area $210 - $163 which is the High-frequency area where the market is likely to end cycles and make a turn.
Since March 18th 2020, Nvidia started a new impulsive cycle looking to unfold as a 5 waves impulse Elliott Wave structure with an initial target at $333 - $356 area before another 3 waves pullback can take place which will be expected to find support above $180 low. The key level at this stage remains at $317 peak because a break above that level is needed to confirm the continuation higher within the Super cycle in wave (III).
In conclusion, NVDA remains one of the most supported stocks and it’s aiming for new all time high as the short term structure is still suggesting further upside to take place against march 2020 low with a target above the previous peak.
Nvidia (NVDA) Daily Chart