Hello fellow traders. Another instrument that we have been trading lately is Nvidia ( $NVDA ) stock. In this technical blog we’re going to take a quick look at the Elliott Wave charts of $NVDA , published in members area of the website. As our members know, NVDA is showing Impulsive sequences in the cycle from the March low, calling for further rally. Consequently, we advised members to avoid selling $NVDA and keep on buying the dips in the sequences of 3,7,or 11 swings whenever get chance. In further text we’re going to explain Elliott Wave Forecast and Trading strategy.
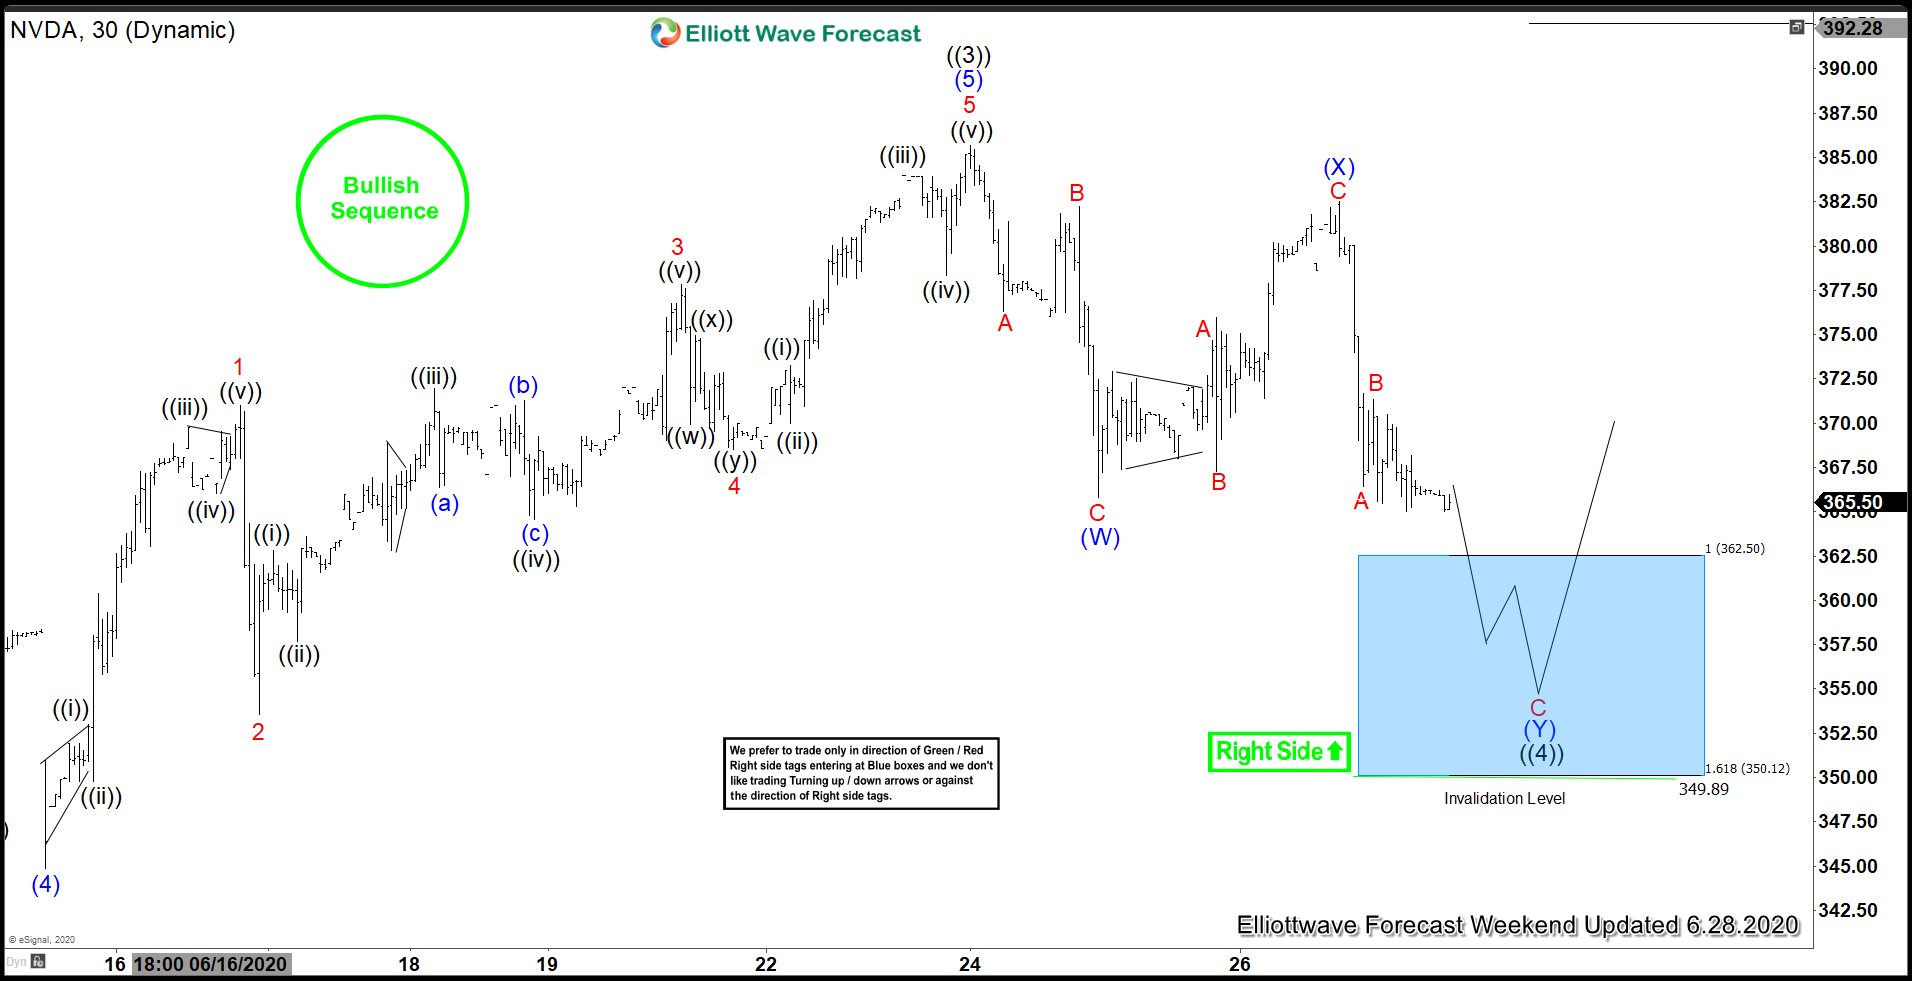
NVDA 1 Hour Elliott Wave Analysis 6.28.2020
Current view suggests NVDA is trading within March 18th cycle that is unfolding as impulsive structure. As of right now NVDA is doing wave ((4)) pull back that looks incomplete at the moment. . The price is still missing another leg down toward equal legs/ blue box area : 362.5-350.12 . As our members know, Blue Boxes are no enemy areas , giving us 85% chance to get a bounce. We don’t recommend selling it against the main trend. Strategy is buying the dips at the marked blue box area when invalidation level comes at 349.89. As the main trend is bullish, we expect to see 3 waves bounce at least from the mentioned zone. As soon as the price reach 50 Fibonacci Retracement against the (X) peak, we should make long positions Risk Free ( put SL at BE).
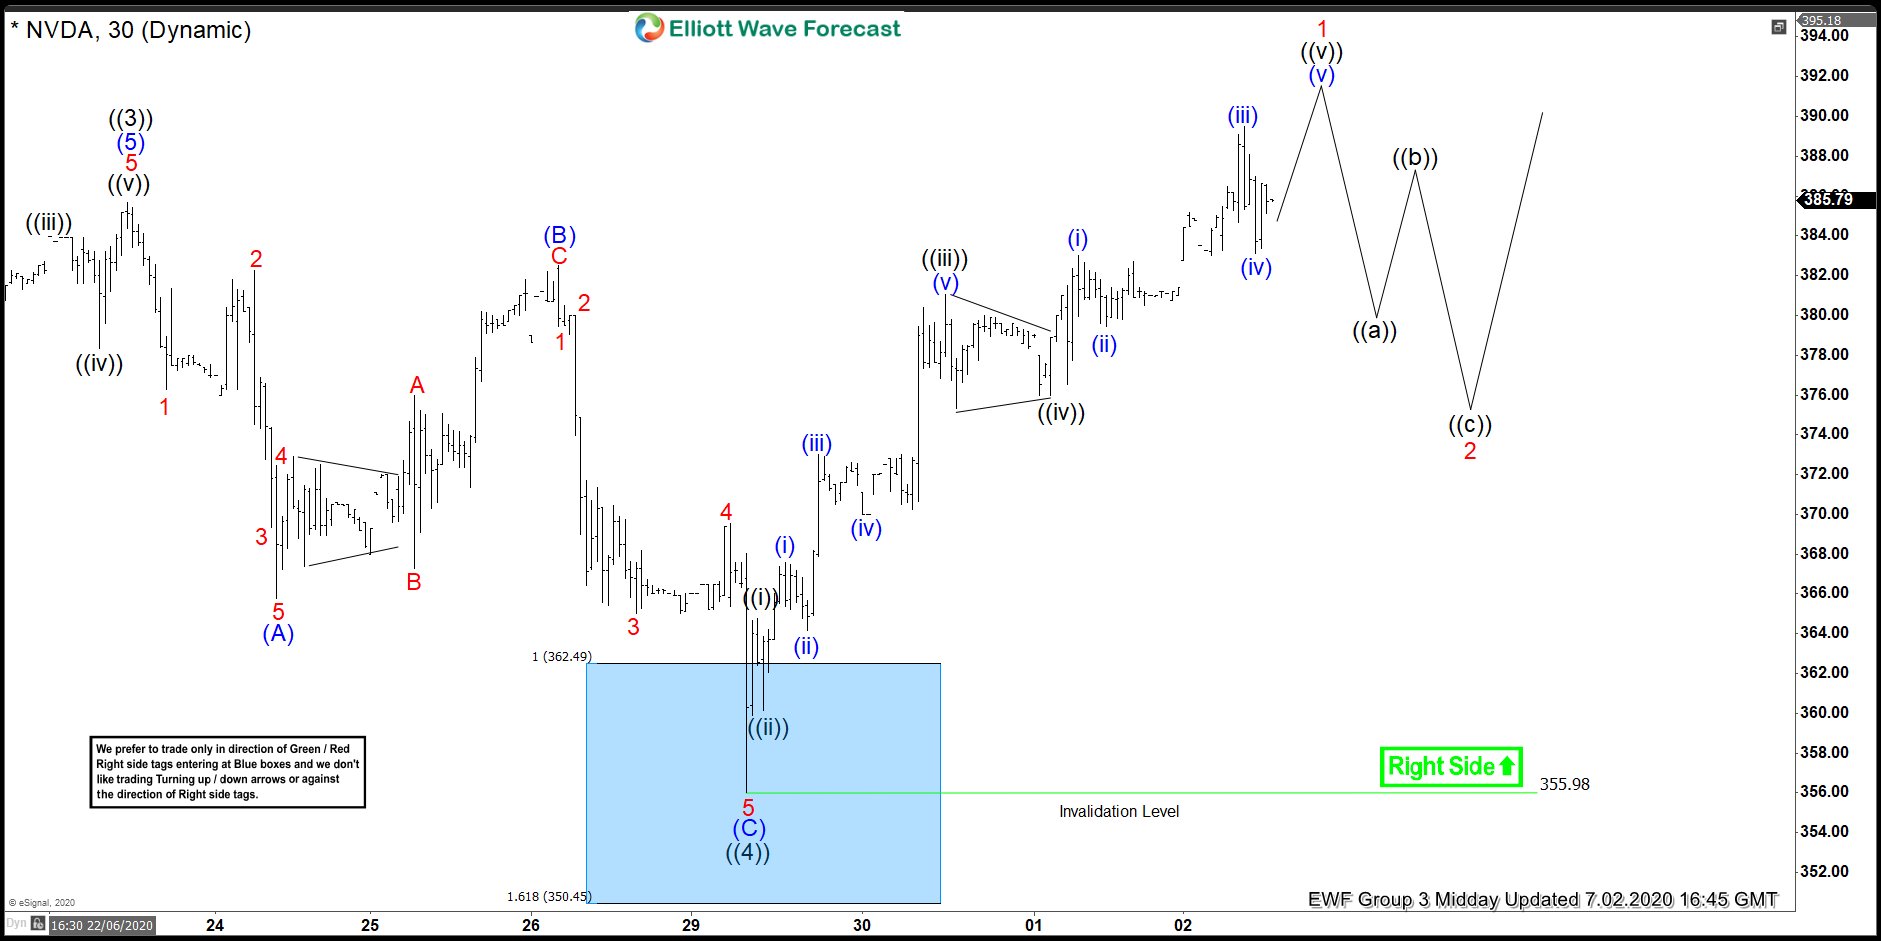
NVDA 1 Hour Elliott Wave Analysis 7.02.2020
NVDA found buyers at 362.5-350.12 , the Blue Box area. We got nice rally from there, when wave ((4)) completed at 355.98 low. All longs from the blue box should be risk free at this stage. Break of 06/23 peak confirmed that next leg up is in progress. Now NVDA should ideally find buyers again in short term dips against the 355.98 low.
Keep in mind that market is dynamic and presented view could have changed in the mean time. Best instruments to trade are those having incomplete bullish or bearish swings sequences. We put them in Sequence Report and best among them are shown in the Live Trading Room . You can check most recent charts in the membership area of the site.
Elliott Wave Forecast