Nvidia Technical Analysis Summary
Below 168.82
Sell Stop
Above 191.48
Stop Loss
| Indicator | Signal |
|---|---|
| RSI | Neutral |
| MACD | Neutral |
| Donchian Channel | Sell |
| MA(200) | Sell |
| Fractals | Sell |
| Parabolic SAR | Sell |
Nvidia Chart Analysis
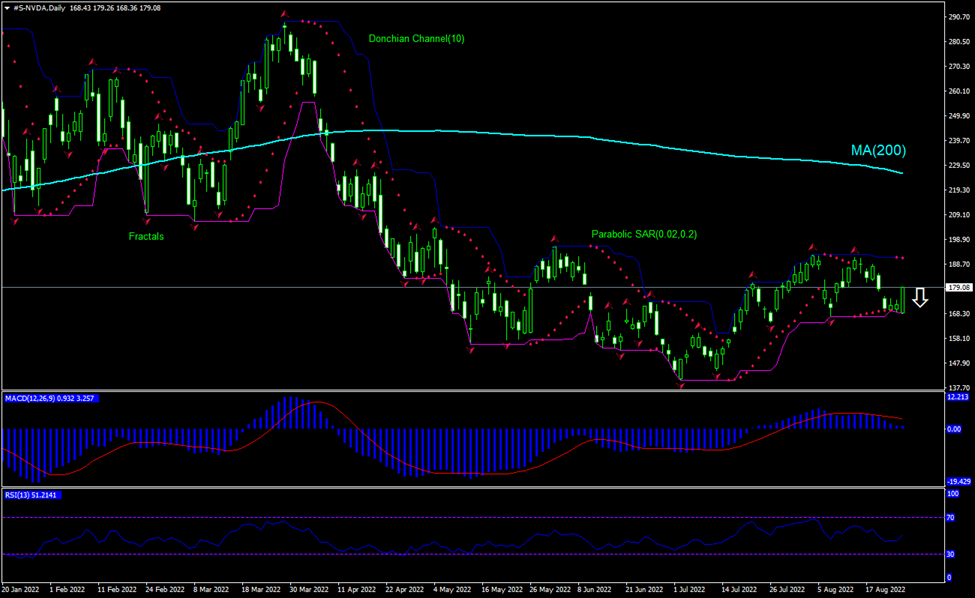
Nvidia Technical Analysis
The technical analysis of the Nvidia stock price chart on daily timeframe shows #S-NVDA, Daily is attempting to retrace up toward the 200-day moving average MA(200) which is declining itself. We believe the bearish momentum will resume after the price breaches below the lower boundary of Donchian channel at 168.82. This level can be used as an entry point for placing a pending order to sell. The stop loss can be placed above the upper boundary of Donchian channel at 191.48. After placing the order, the stop loss is to be moved every day to the next fractal high, following Parabolic indicator signals. Thus, we are changing the expected profit/loss ratio to the breakeven point. If the price meets the stop loss level (191.48) without reaching the order (168.82), we recommend cancelling the order: the market has undergone internal changes which were not taken into account.
Fundamental Analysis of Stocks - Nvidia
Nvidia stock price edged up despite the chip maker forecast next quarter revenue below analysts’ estimates. Will the Nvidia stock price continue rebounding?
Nvidia reported on Wednesday second quarter 2022 revenue of $6.7 billion, versus forecasts of $6.83 billion. Its earnings missed expectations 1.9%. Data center revenue grew 61% over year to a record $3.81 billion in the second quarter. Gaming revenue fell 33% from a year ago to $2.04 billion. As to next quarter guidance, Nvidia expects third quarter revenue of about $5.9 billion, plus or minus 2%, compared with analysts’ consensus estimate of $6.92 billion. Shares edged up 0.1% on the day after quarterly report.