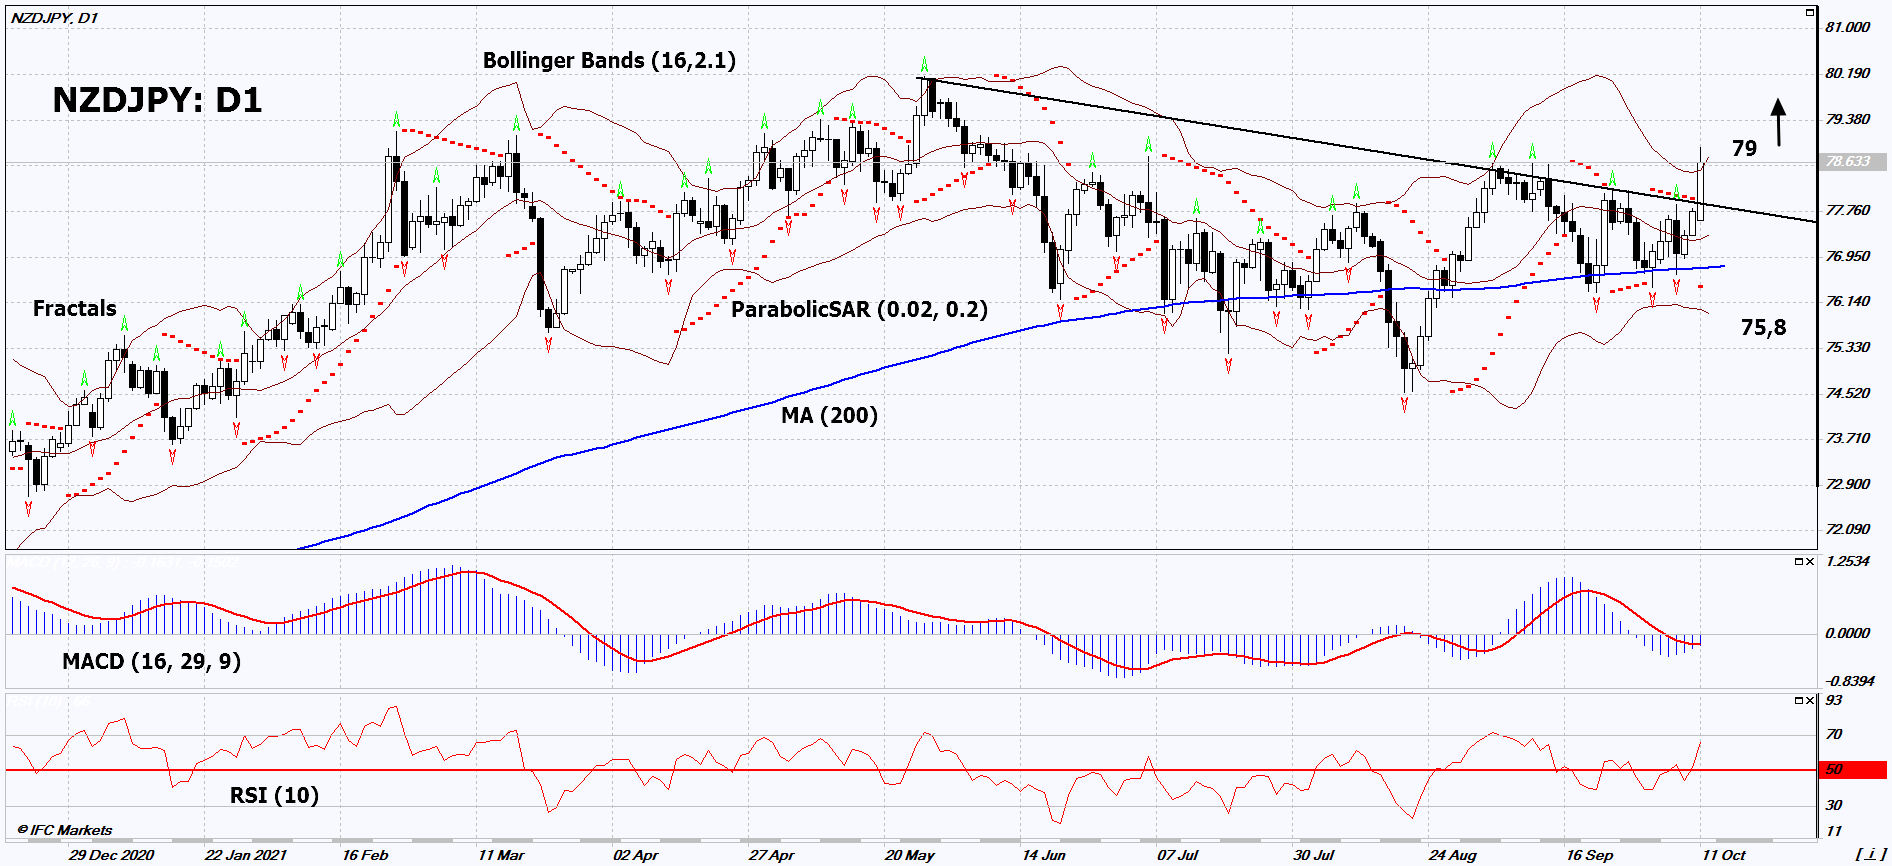
NZD/JPY Technical Analysis Summary
Buy Stop: Above 79
Stop Loss: Below 75.8
| Indicator | Signal |
|---|---|
| RSI | Neutral |
| MACD | Neutral |
| MA(200) | Neutral |
| Fractals | Buy |
| Parabolic SAR | Buy |
| Bollinger Bands | Buy |
NZD/JPY Chart Analysis
NZD/JPY Technical Analysis
On the daily timeframe, NZDJPY: D1 broke up the resistance line of the intermediate downtrend. The currency pair has exited the triangle with a 200-day moving average line at the bottom. A number of technical analysis indicators have formed signals for further growth. We do not rule out a bullish movement if NZDJPY: D1 rises above the upper Bollinger band and the last high: 79. This level can be used as an entry point. The initial risk limitation is possible below the last three lower fractals, the Parabolic signal, the 200-day moving average and the lower Bollinger band: 75.8. After opening a pending order, move the stop to the next fractal low following the Bollinger and Parabolic signals. Thus, we change the potential profit / loss ratio in our favor. The most cautious traders, after making a deal, can go to the four-hour chart and set a stop-loss, moving it in the direction of movement. If the price overcomes the stop level (75.8) without activating the order (79), it is recommended to delete the order: there are internal changes in the market that were not taken into account.
Fundamental Analysis of Forex - NZD/JPY
Reserve Bank of New Zealand (RBNZ) raised its rate to 0.5% from 0.25%. NZDJPY quotes continue to grow?
The upward movement means the strengthening of the New Zealand dollar against the Japanese yen. The RBNZ rate is now the highest among the most developed countries with liquid currencies. This could be a positive factor for the New Zealand dollar. As a reminder, the Bank of Japan (BoJ) rate is currently below zero at -0.1%. GDP growth in New Zealand in the 2nd quarter of 2021 was 17.4% in annual terms. In Japan, the same indicator rose by only 1.9%. The negative factor for the yen was the reduction in consumer spending (Household Spending) in August by 3% in annual terms. They were published on Friday October 8th. Recall that the dynamics of the New Zealand dollar is influenced not only by the economic indicators of New Zealand itself, but also by China. The PRC is one of the main importers of New Zealand goods. Many different economic indicators will be published this week, both in New Zealand and China, as well as in Japan.
