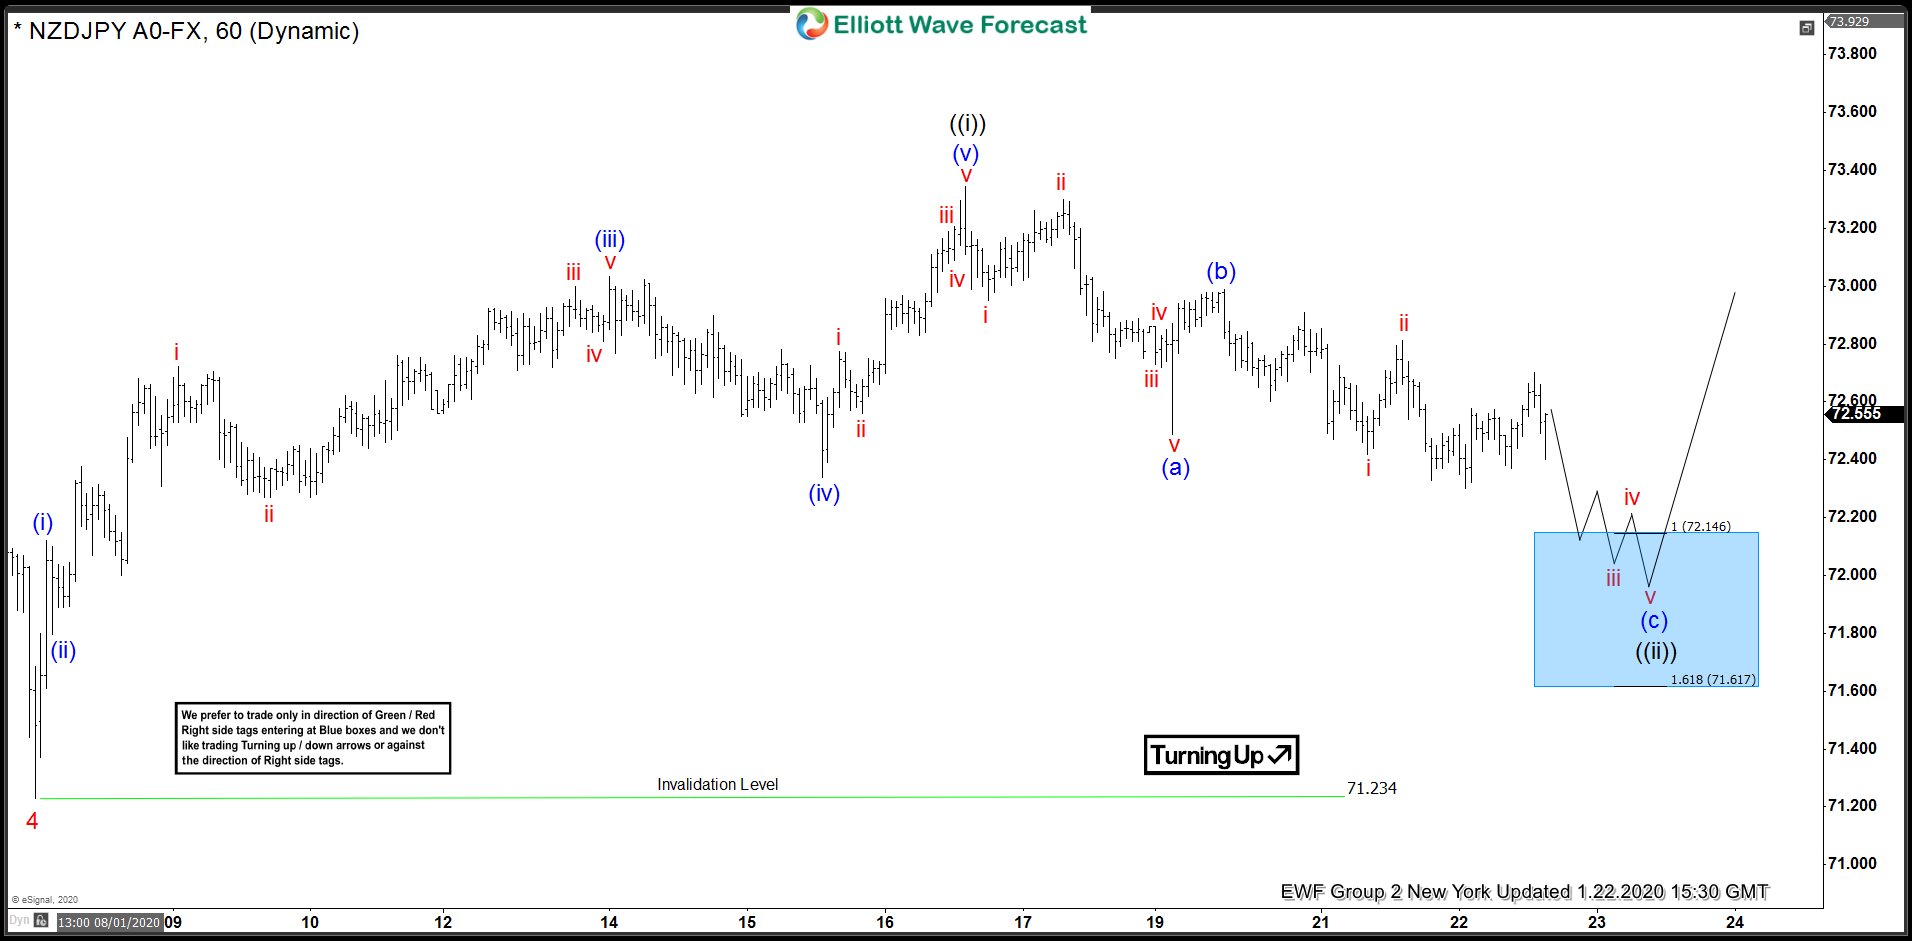
In this blog, we are going to take a quick look at the Elliottwave chart of NZDJPY. The chart from 1.22.2020 New York update showed that NZDJPY ended wave 4 at 71.234 low. The pair then extended higher in wave ((i)) of 5. Wave ((i)) ended at 73.343 high. From there the pair is proposed to be doing a 3 waves pullback in wave ((ii)). Wave (a) of ((ii)) ended at 72.489 low and wave (b) ended at 72.989 high. Afterwards, we expect the pair to extend lower in 5 waves to complete wave ©. The 100%-161.8% Fibonacci extension of (a) - (b) where wave © can end is between 71.617-72.146 area, highlighted with a blue box. The blue box area is the area where we expect buyers to appear for an extension higher or 3 waves bounce at least.
NZDJPY 1.22.2020 1 Hour New York Elliott Wave Update
The chart below from 1.24.2020 London update shows that the count was adjusted. Instead of ending wave ((i)), the high at 73.343 is proposed to be the ending of wave X. Wave (a) - (b) was also adjusted to (w) - (x). Nonetheless, the 100%-161.8% Fibonacci extension of wave (w) - (x) remains the same between 71.617-72.146 area. We are still expecting the pair to react from the blue box area for a 3 waves bounce at least. The pair reached the blue box area and ended wave (y) at 71.899 low. It has since bounced higher from the blue box area and allowed members who bought at that area a risk free position. Wave (a) of ((x)) ended at 72.673 high. While above 71.899 low, the pair can still extend higher after a pullback in wave (b) to complete wave ((x)).
NZDJPY 1.24.2020 1 Hour London Elliott Wave Update
