NZDUSD Technical Analysis August 8/2020
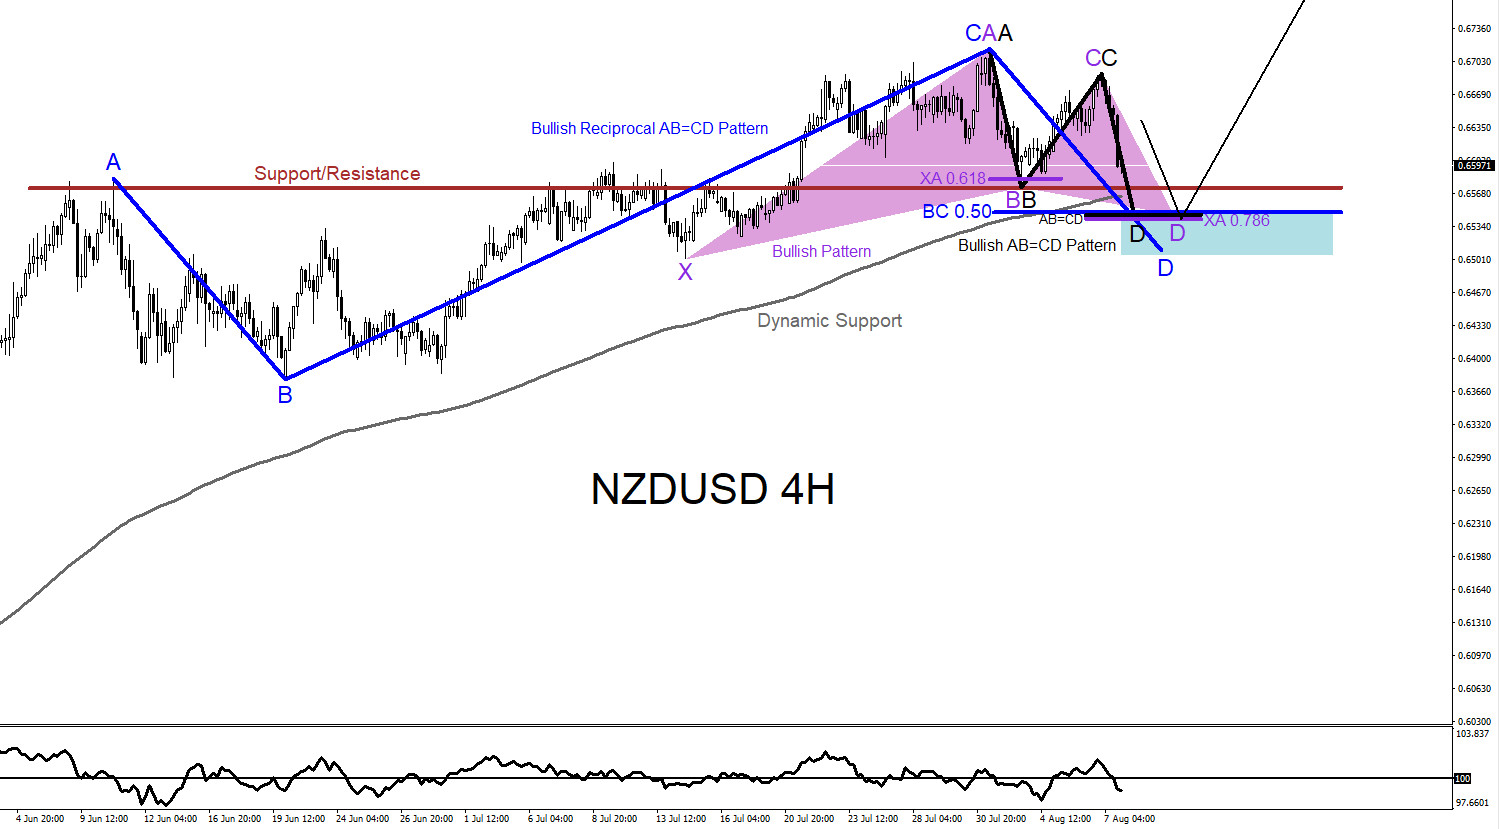
NZDUSD remains bullish as long as the June 22/2020 0.6378 low remains untouched. In this analysis of the NZDUSD pair, market patterns will be used to determine where price can possibly reverse and bounce higher from. In the chart below, there are several possible bullish patterns that can trigger BUYS near the same area. The blue bullish reciprocal AB=CD pattern triggers BUYS at the BC 0.50% Fib. retracement level, purple bullish pattern triggers BUYS at the XA 0.786% Fib. retracement level and the black bullish AB=CD pattern also triggers buys at the same levels of the purple and blue bullish patterns. Traders still need to be patient and wait to see if price dips lower to the buy trigger levels. Also for more added confirmation watch for price to respect the the dynamic support (grey 200 moving average) and the static support/resistance level (brown). Price respecting the dynamic support and the static support level will add more bulls to enter the market and give more momentum for a possible bounce higher. Traders will need to wait and watch how price reacts in the blue box reversal zone and watch to see if the market shows a movement higher off any of the bullish pattern trigger levels. If looking to trade NZDUSD stops should be placed at the point B low of the blue bullish pattern, or for tighter stops at the point X low of the purple bullish pattern, looking for a rally higher to extend above the July 31/2020 highs. Only time will tell what NZDUSD will do but at least now you are aware of the possible area where the pair can bounce higher from.
NZDUSD 4 Hour Chart August 7/2020