Oats Technical Analysis Summary
Sell Stop։ Below 700
Stop Loss: Above 780
| Indicator | Signal |
|---|---|
| RSI | Sell |
| MACD | Sell |
| MA(200) | Neutral |
| Fractals | Neutral |
| Parabolic SAR | Sell |
| Bollinger Bands | Neutral |
Oats Chart Analysis

Oats Technical Analysis
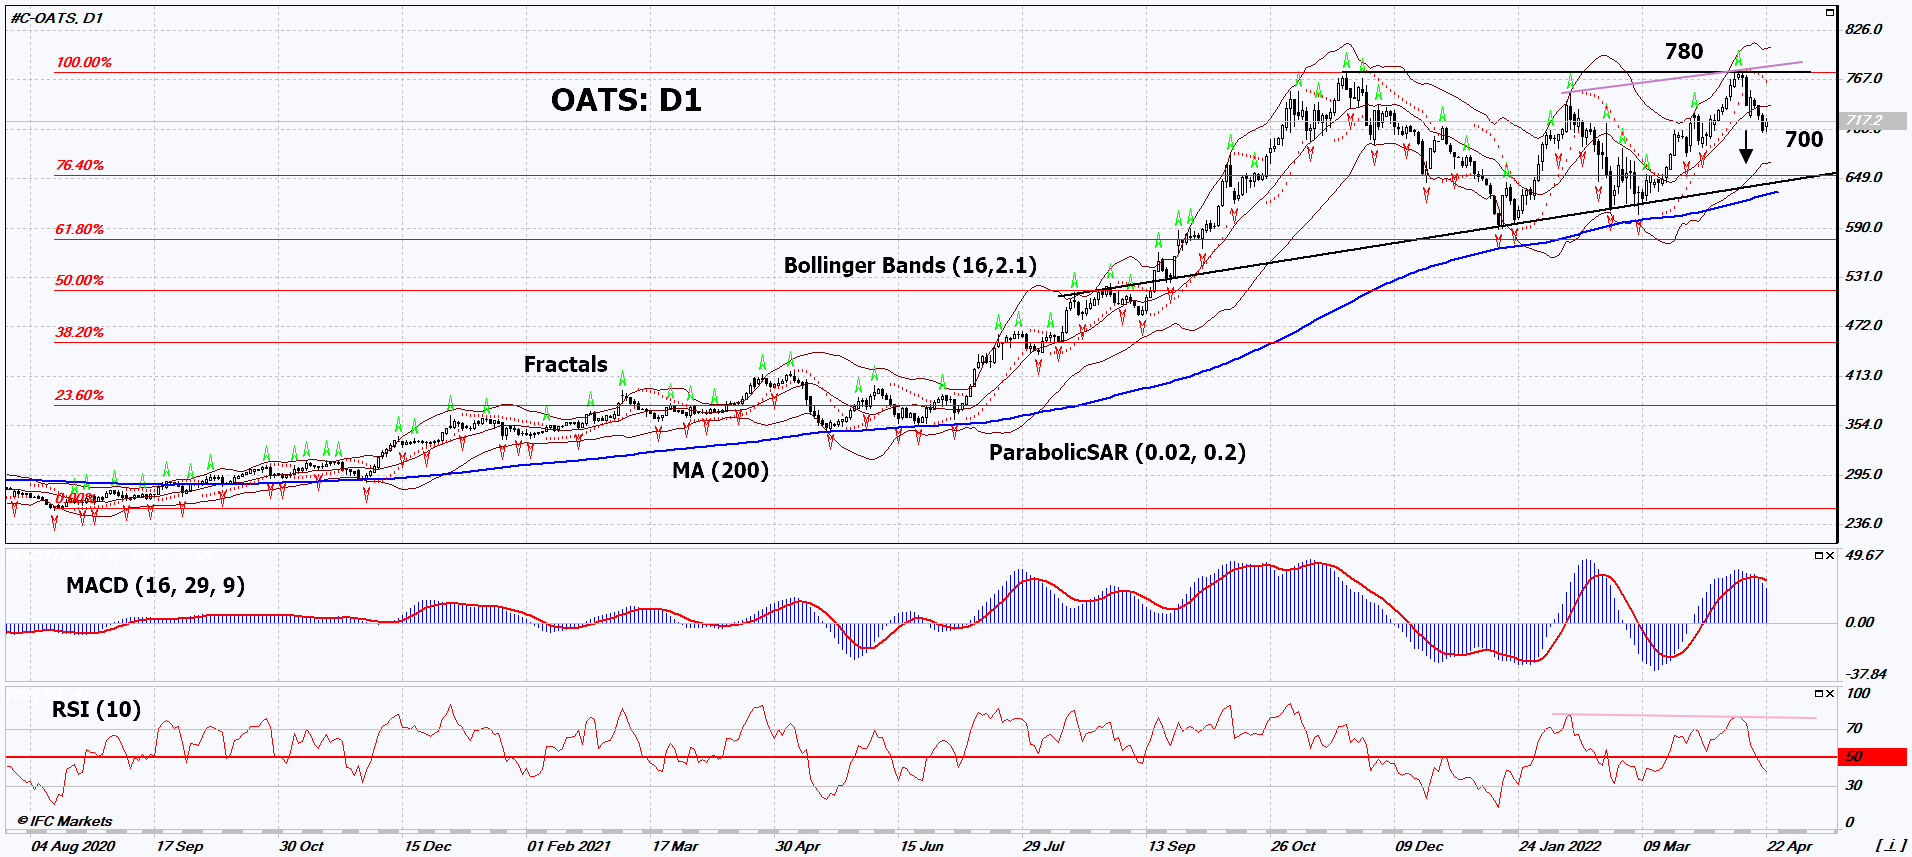
On the daily timeframe, OATS: D1 failed to break through the upper border of the long-term triangle and is moving towards its lower border. A number of technical analysis indicators formed signals for further decline. We don’t rule out a bearish movement if OATS: D1 falls below the latest low: 700. This level can be used as an entry point. The initial risk limit may be higher than the historical high, the last up fractal, the upper Bollinger band and the Parabolic signal: 780. After opening a pending order, we move the stop following the Bollinger and Parabolic signals to the next fractal high. Thus, we are changing the potential profit/loss ratio in our favor. The most cautious traders after making a trade can go to the four-hour chart and set a stop-loss, moving it in the direction of movement. If the price overcomes the stop level (780) without activating the order (700), it is recommended to delete the order: the market is undergoing internal changes that were not taken into account.
Fundamental Analysis of Commodities - Oats
The United States Department of Agriculture (USDA) has cut its global oat consumption forecast. Will the OATS quotes continue to decline?
In its April review, the USDA cut its global oat consumption forecast for the 2021/2022 season to 22.9 million tones. This is 8.2% less than in the 2020/2021 season and 1.7% less than the forecast published in March. The forecast for oat consumption in the US this season remained at the same level of 2.02 million tons. Another negative factor was Russia’s message about limiting the export of various types of grain in the 2021/2022 season. Russian oats have not yet been included in this list, and its supply to the world market may even increase. USDA predicts an increase in oat exports from Russia in the 2021/2022 season by 67% compared to the previous season - 150 thousand tons. Russia occupies the 2nd place in the world in the export of oats after Canada, and the European Union is in the 3rd place.
