Hello fellow traders. In this technical blog we’re going to take a quick look at the Elliott Wave charts of OIL, published in members area of the website. As our members know, OIL is another instrument that we have been trading lately. The price is showing bullish sequences in the cycle from the April 21st low . The price structure of OIL has been calling for further rally. Consequently, we advised members to avoid selling OIL and keep on buying the dips in the sequences of 3,7,or 11 swings whenever get chance. In further text we’re going to explain Elliott Wave Forecast and trading strategy.
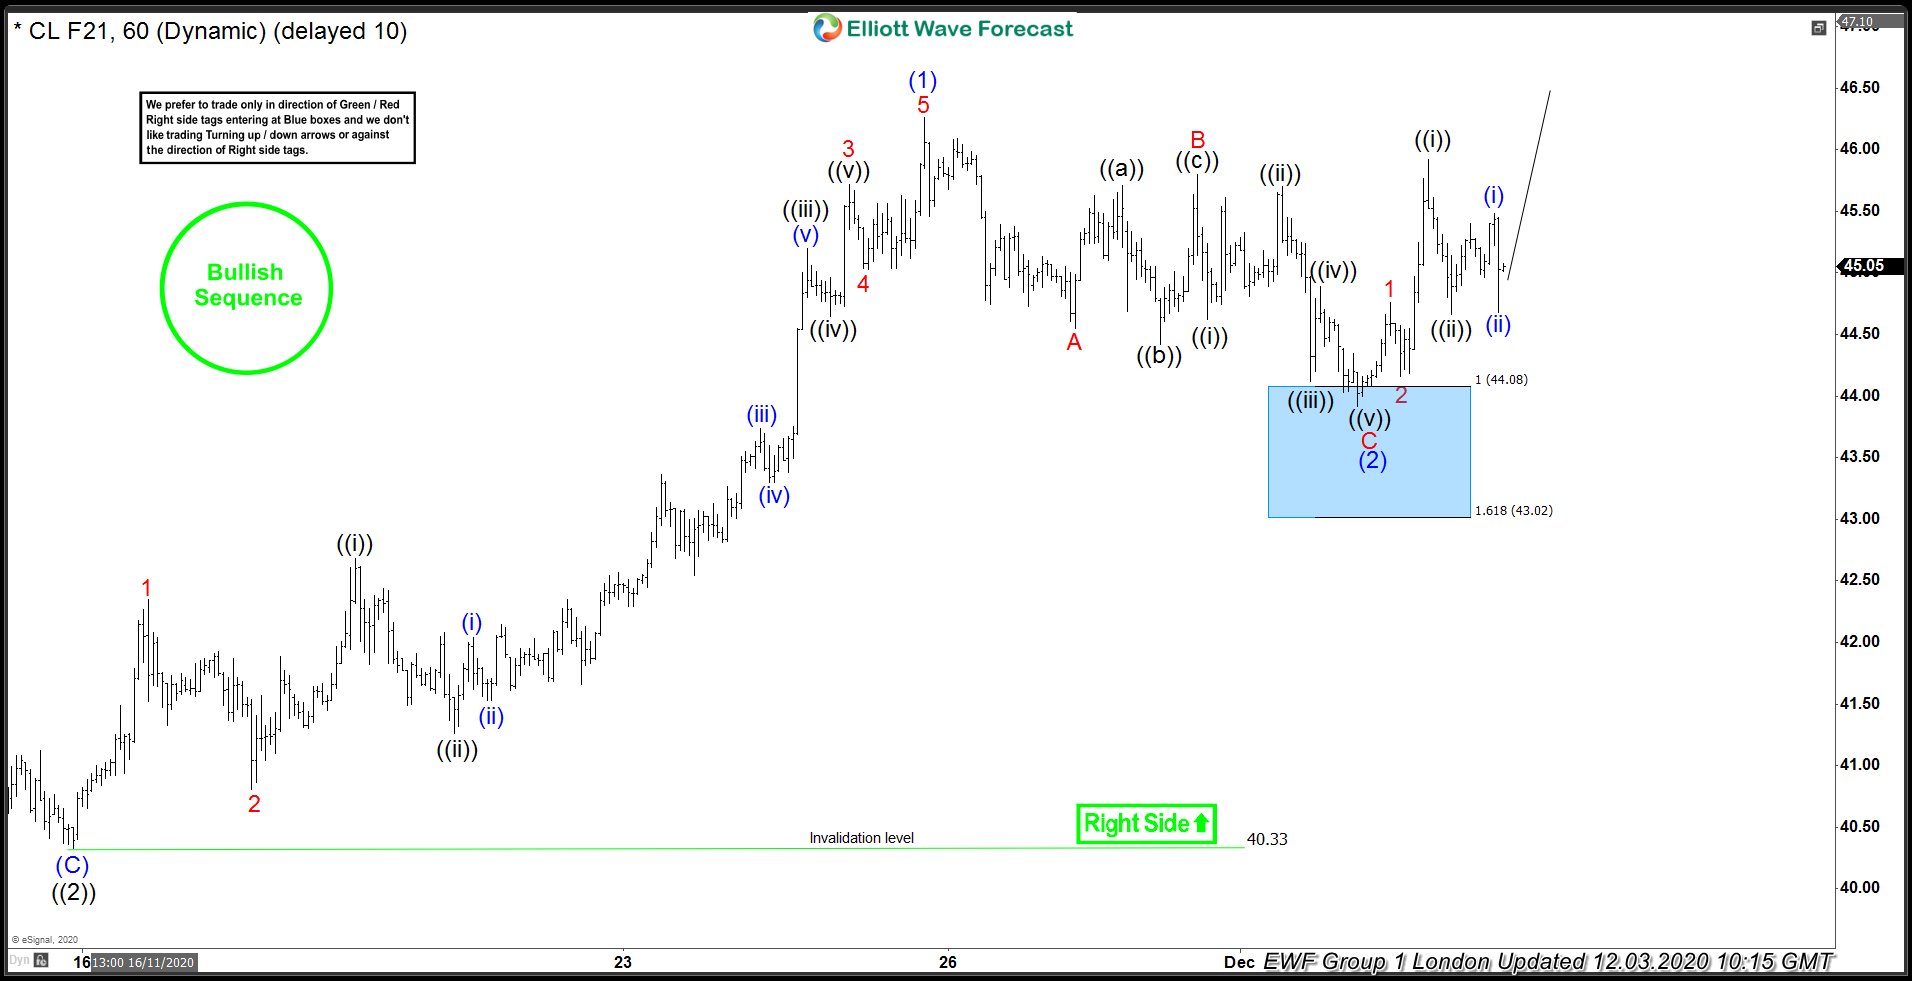
OIL 1 Hour Elliott Wave Analysis 12.01.2020
Wave (2) blue pull back is unfolding as Elliott Wave Zig Zag and still looks incomplete at the moment. The price is reaching equal legs area at 44.08-43.02 area . As our members know, Blue Boxes are no enemy areas , giving us 85% chance to get a bounce. We don’t recommend selling it against the main trend and favor the long side from the marked blue box area. As the main trend is bullish, we expect to see 3 waves bounce at least from the mentioned zone. As soon as the price reach 50 Fibonacci Retracement against the B red peak, we should make long positions Risk Free ( put SL at BE).
You can learn more about Zig Zag Elliott Wave Patterns at our Free Elliott Wave Educational Web Page .

OIL 1 Hour Elliott Wave Analysis 12.03.2020
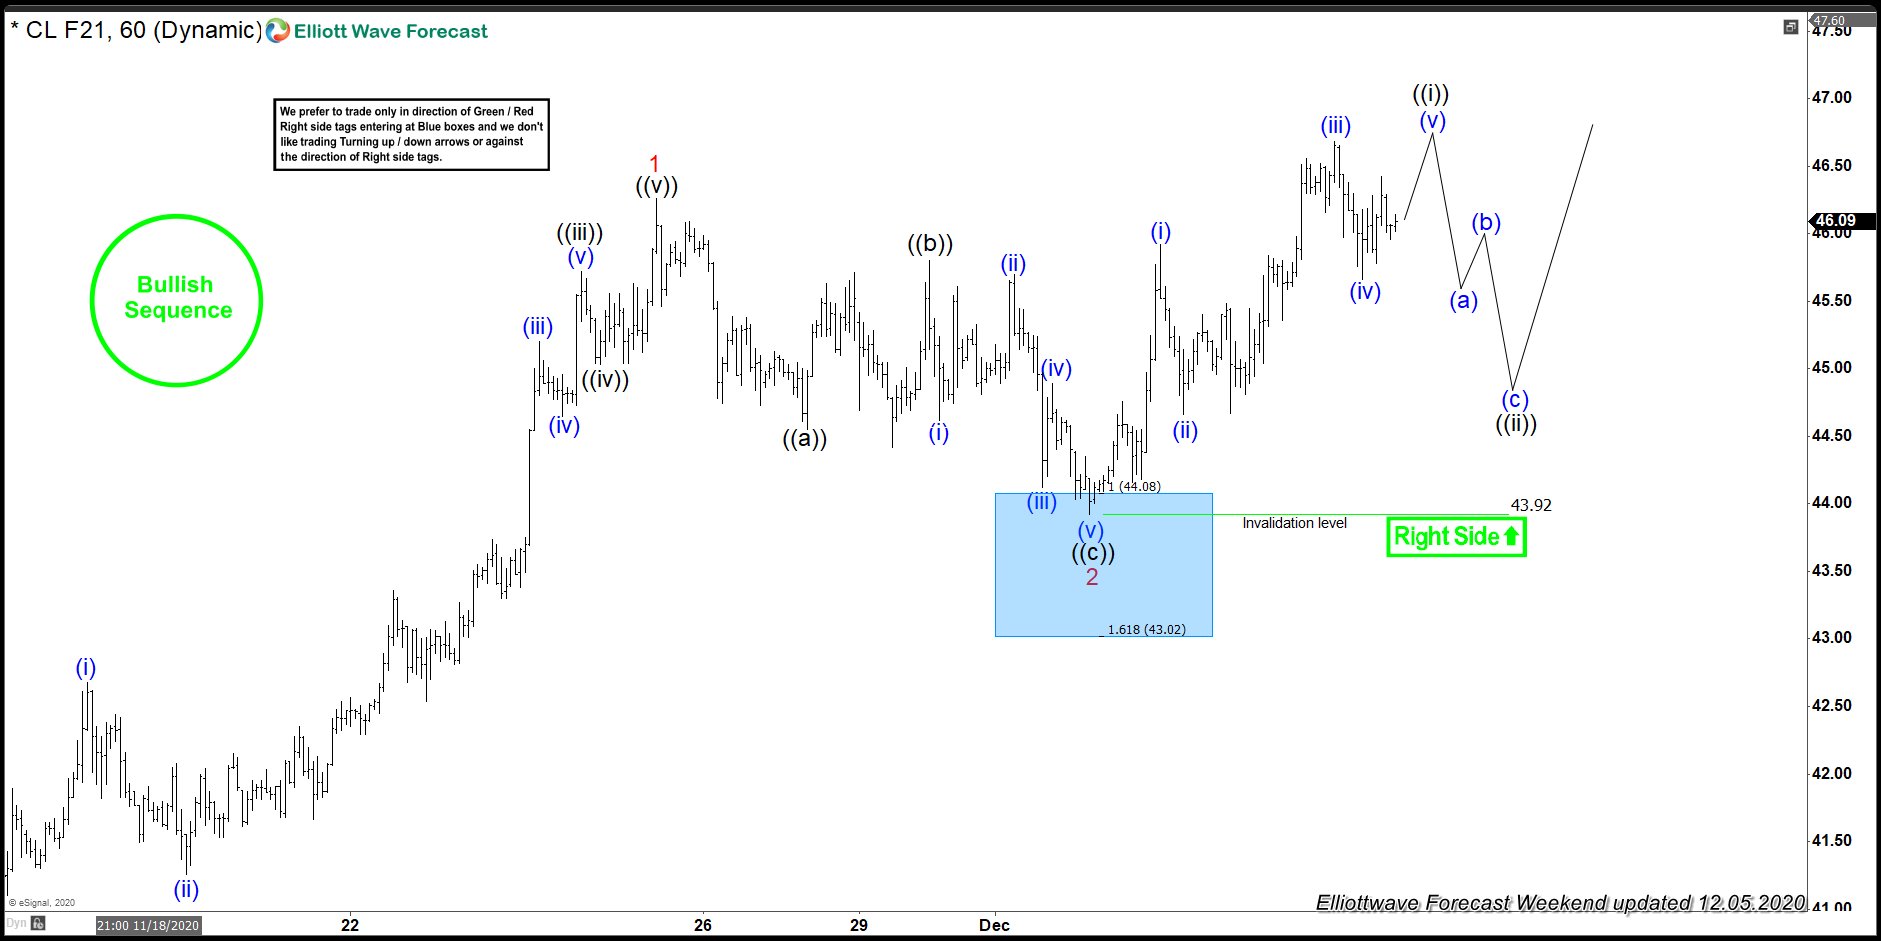
OIL found buyers at 44.08-43.02 area , the Blue Box area. We got nice rally from there, when wave (2) pull back completed at 43.92 low. All longs from the blue box should be risk free at this stage. We would like to see further rally which will break (1) blue peak (11/25 ). Once proposed break happens we will get confirmation next leg up is in progress. We don’t recommend selling it, and favor staying long from the blue box in risk free positions.
OIL1 Hour Elliott Wave Analysis 12.05.2020
Eventually we got more upside and break above 11/25 peak which confirmed next leg up is in progress. Another short term leg up is possible to complete 5 waves up from the 43.92 low before we get pull back ((ii)) black. The commodity should ideally remain bullish against the 43.92 low in first degree and found buyers in 3,7,11 swings in wave ((ii)) pull back.
You can check most recent charts in the membership area of the site. Keep in mind not every chart is trading recommendation. The best instruments to trade are those having incomplete bullish or bearish swings sequences. We put them in Sequence Report and best among them are shown in the Live Trading Room .
Source: OIL ( $CL_F ) Buying The Dips At The Blue Box Area
Elliott Wave Forecast