Hello fellow traders. In this technical blog we’re going to take a quick look at the Elliott Wave charts of OIL , published in members area of the website. As our members know, commodities have been giving us nice profits recently. OIL is another commodity that has given us rally from the Blue Box area. The price structure has been showing higher high sequences. Consequently, we advised members to avoid selling OIL and keep on buying the dips in the sequences of 3,7,or 11 swings whenever get chance. In further text we’re going to explain Elliott Wave Forecast.
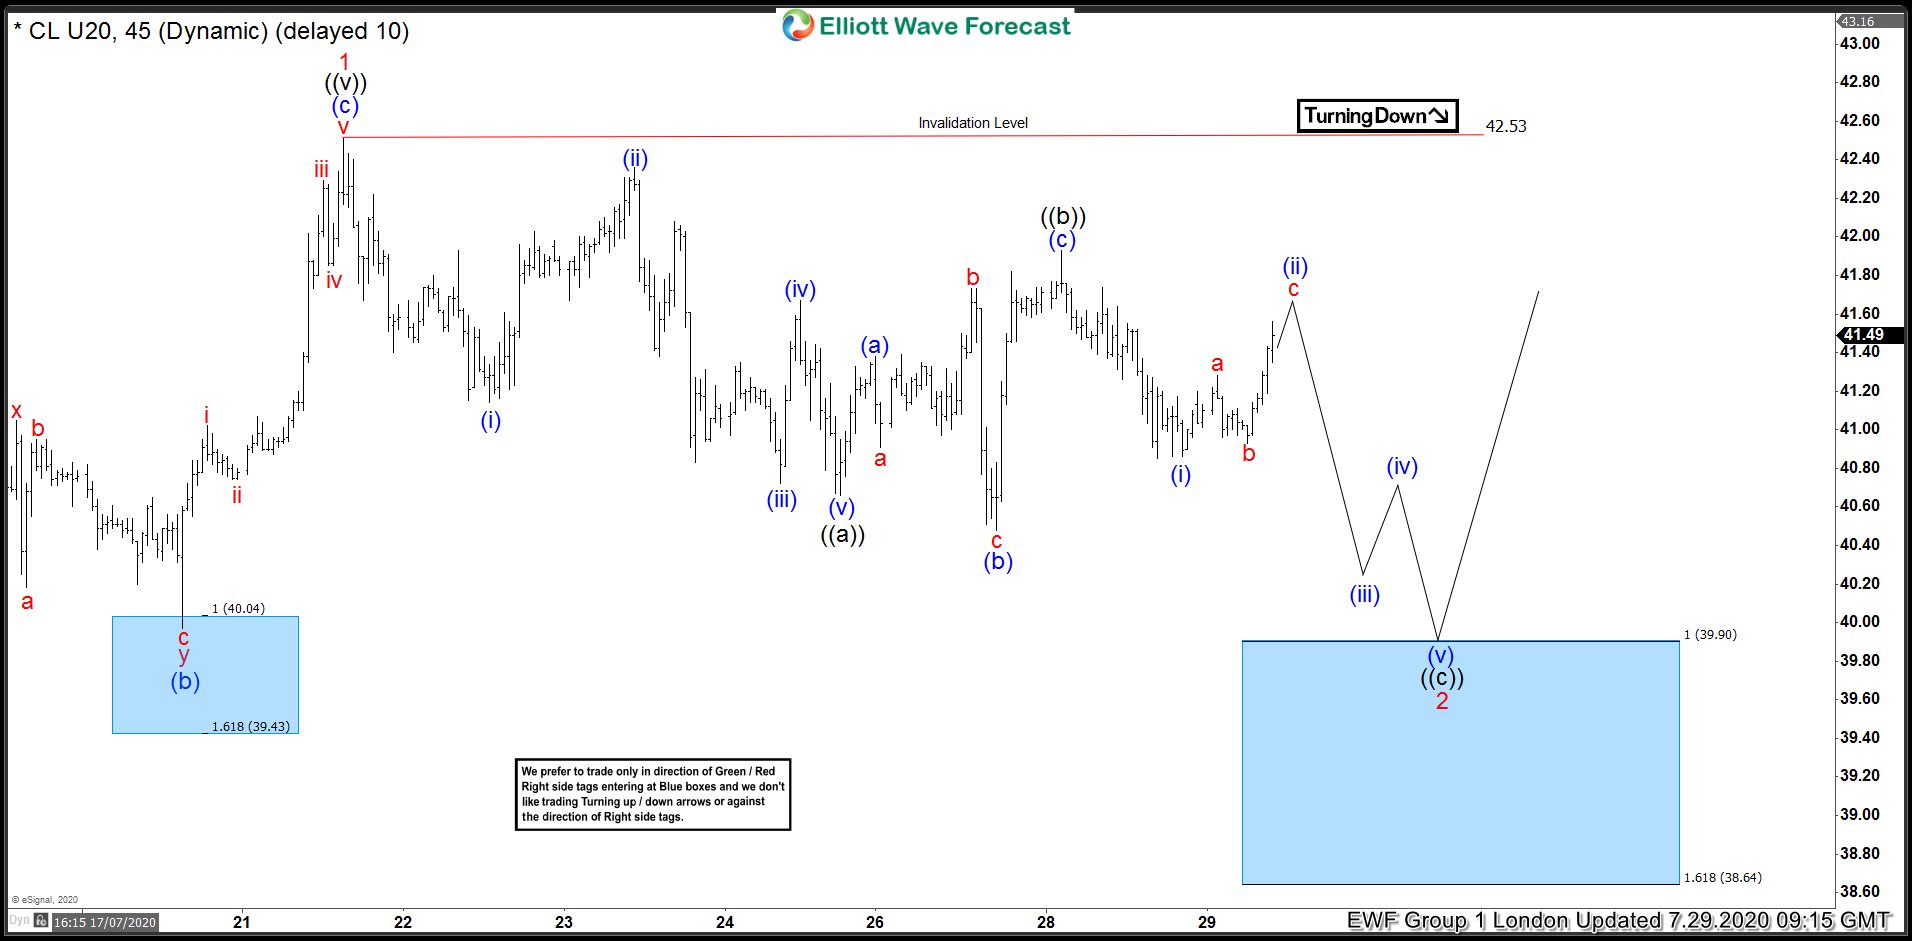
OIL 1 Hour Elliott Wave Analysis 7.29.2020
OIL remains bullish against the 37.27 pivot. The commodity is doing pull back 2 red that still looks incomplete at the moment. As far as the price stays below ((b)) black high. We expect to see another leg down toward 39.9-38.64 area( buyers zone). At the mentioned zone buyers should ideally appear for further rally toward new highs. As our members know, Blue Boxes are no enemy areas , giving us 85% chance to get a bounce. We don’t recommend selling OIL against the main trend. We favor the long side from the marked blue box area. As the main trend is bullish, we expect to see 3 waves bounce at least from the mentioned zone.
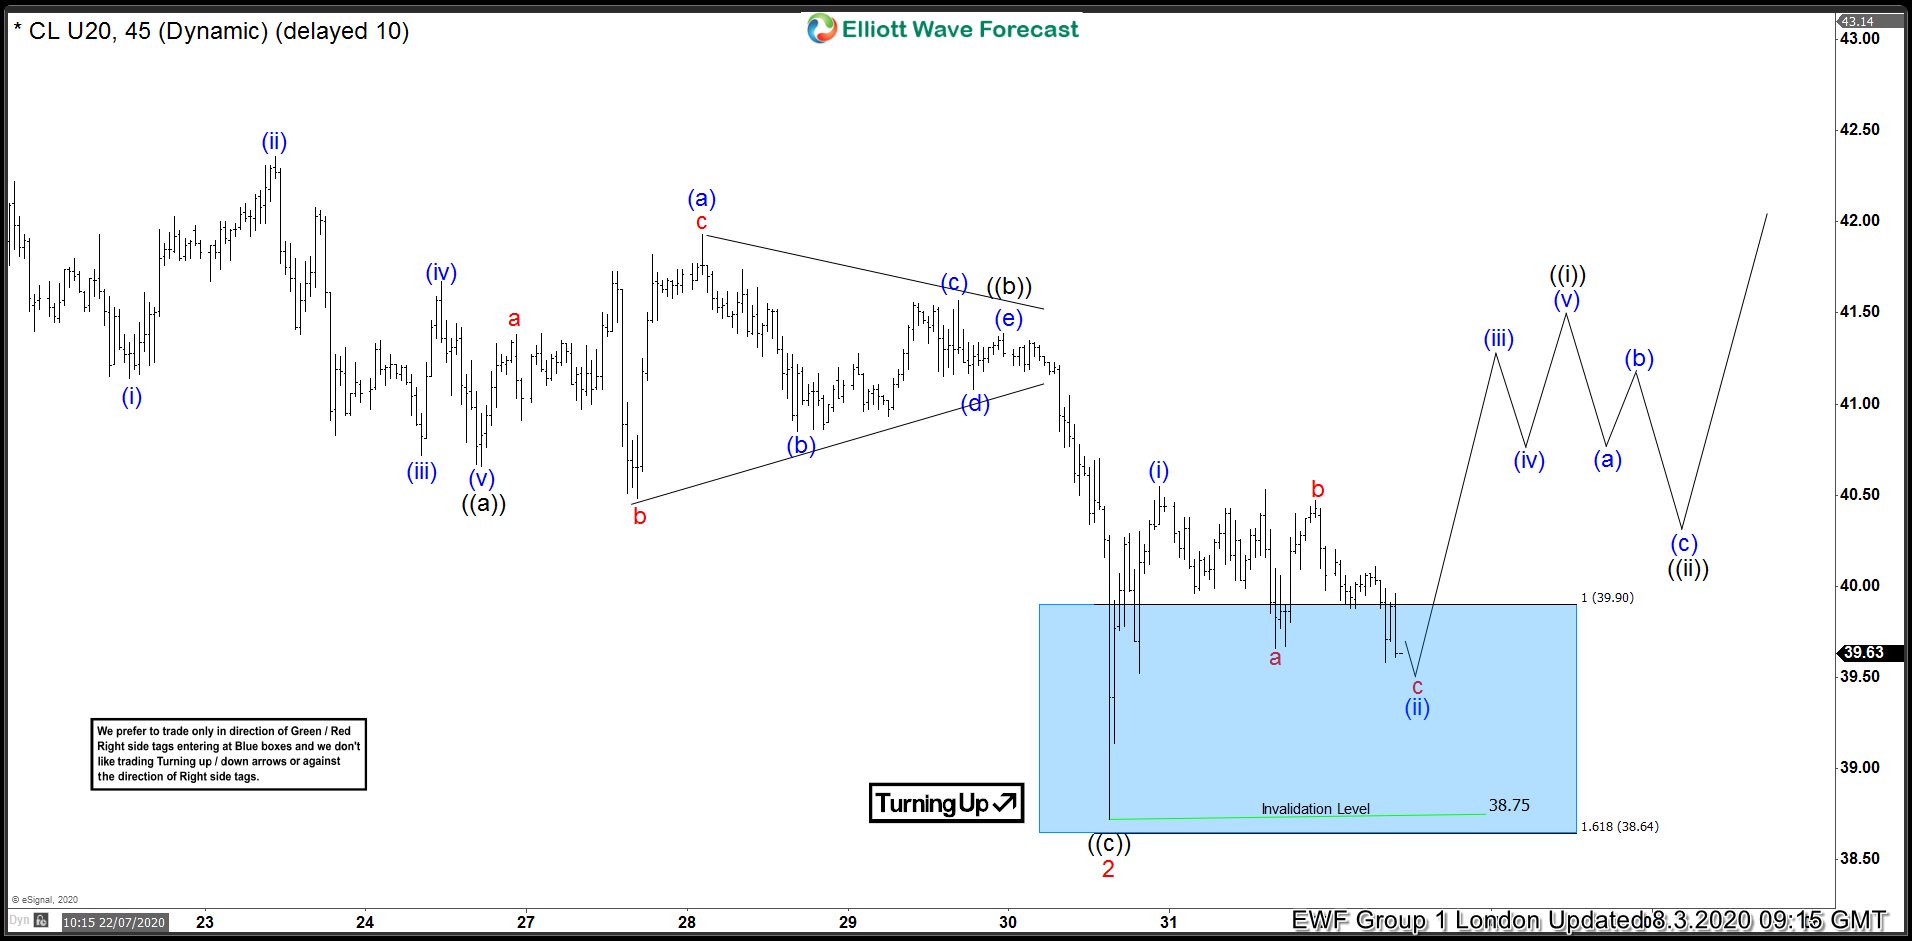
OIL 1 Hour Elliott Wave Analysis 8.3.2020
After sideways consolidation, we got proposed extension down toward blue box. The commodity found buyers at 39.9-38.64 area. The bounce is still shallow at the moment, however as far as the price stays above 38.75 low, pull back can be done there. We would like to see further separation from the 38.75 low and ideally break above 07/21 peak (42.53) to confirm next leg up is in progress.
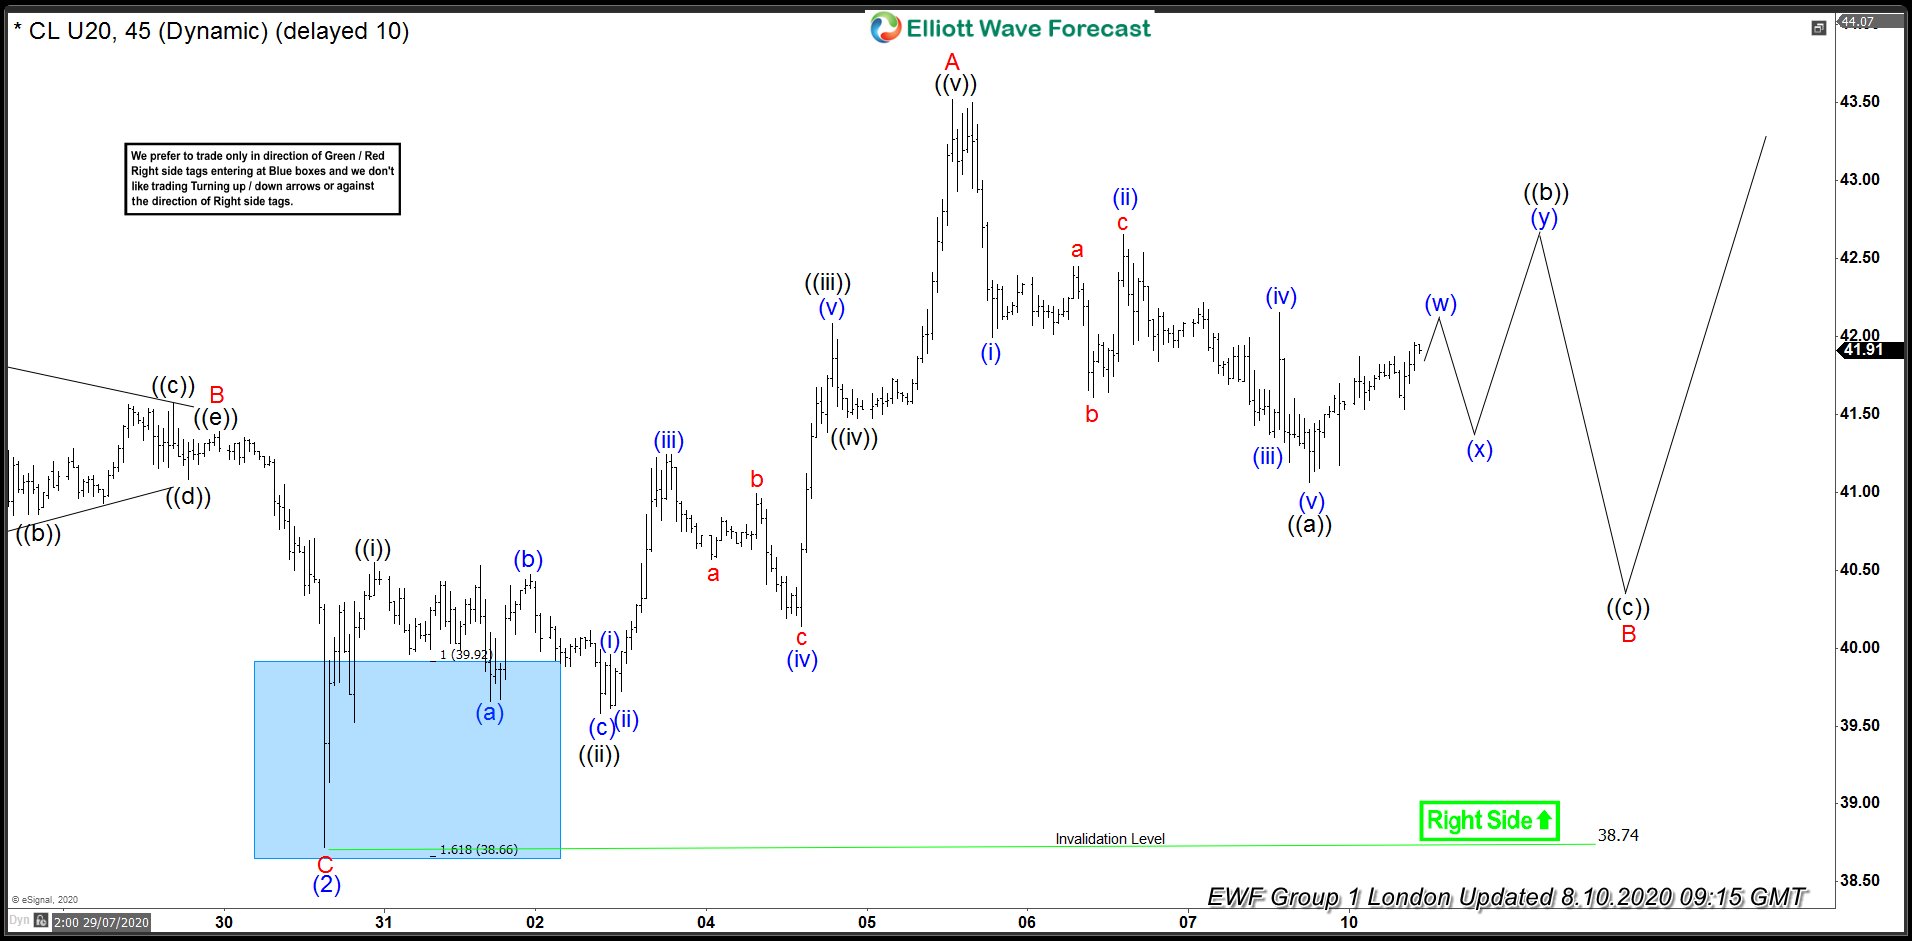
OIL 1 Hour Elliott Wave Analysis 8.10.2020
38.75 low held well during the short term pull back and we got rally. Eventually the price broke above 07/21 peak (42.53). Now the commodity should ideally remain supported as far as 38.74 pivot holds. Current view suggests that pull back B red can be still in progress as shown on the chart. We got 5 waves down from the peak which can be only the first leg ((a)) of B.
Keep in mind market is dynamic and presented view could have changed in the mean time. You can check most recent charts in the membership area of the site. Best instruments to trade are those having incomplete bullish or bearish swings sequences.We put them in Sequence Report and best among them are shown in the Live Trading Room
Elliott Wave Forecast