Oil vs Gas Technical Analysis Summary
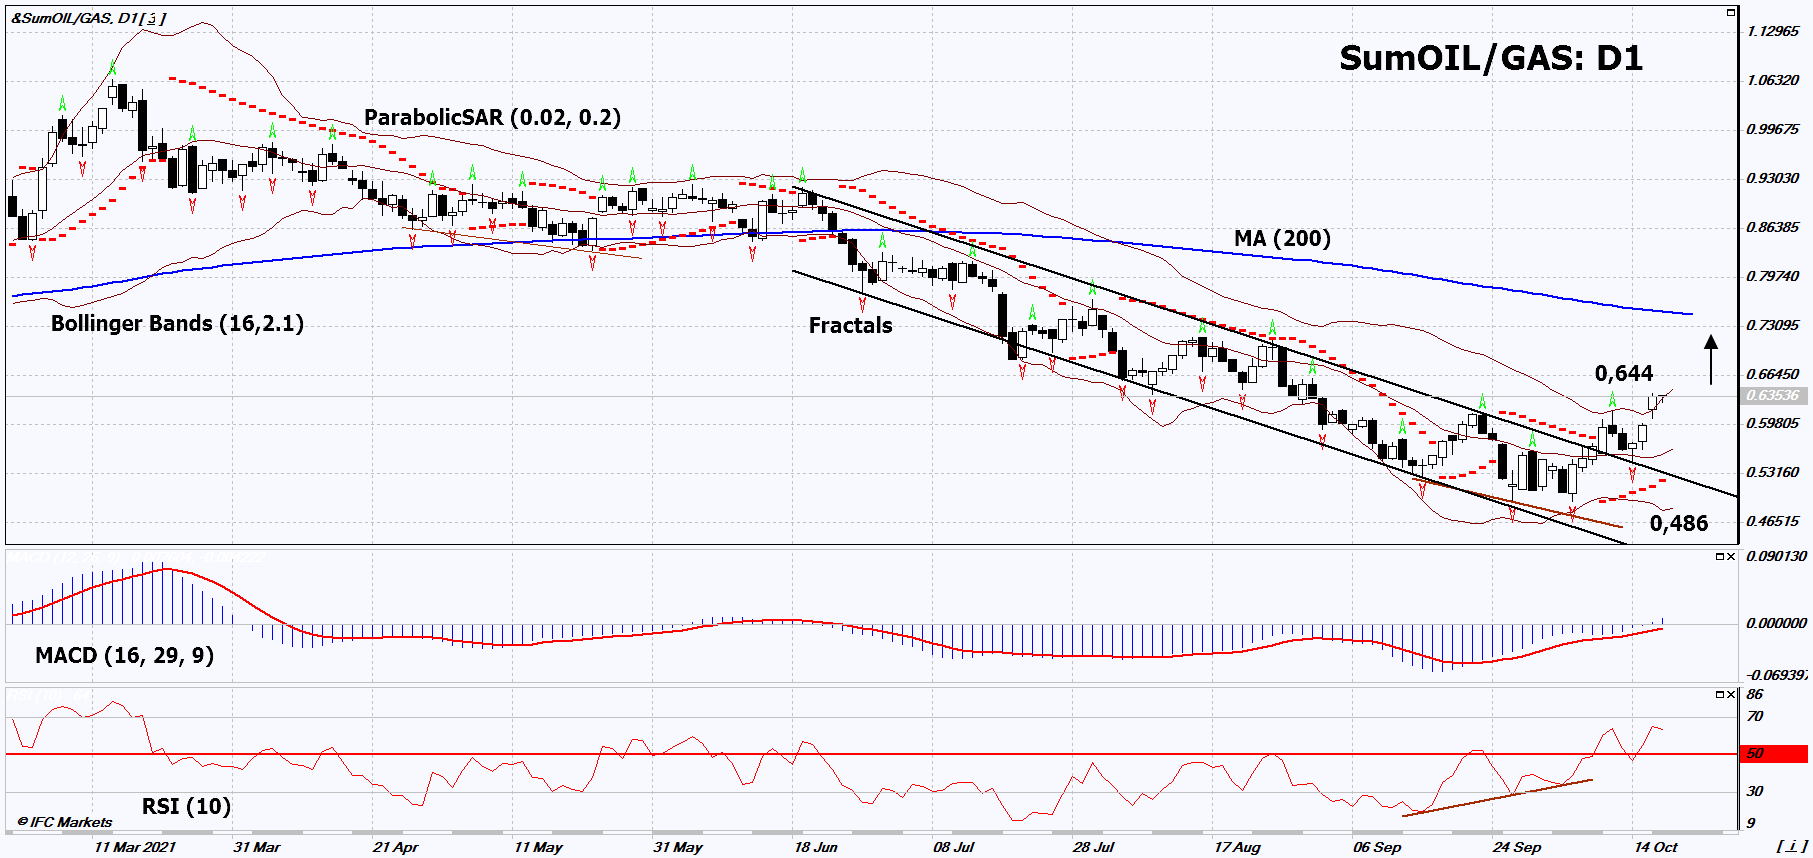
Buy Stop:Above 0.644
Stop Loss:Below 0.486
| Indicator | Signal |
|---|---|
| RSI | Buy |
| MACD | Buy |
| MA(200) | Neutral |
| Fractals | Buy |
| Parabolic SAR | Buy |
| Bollinger Bands | Buy |
Oil vs Gas Chart Analysis
Oil vs Gas Technical Analysis
On the daily timeframe, SumOIL/GAS: D1 broke up the resistance line of the declining channel. A number of technical analysis indicators have generated signals for further growth. We do not rule out a bullish movement if SumOIL/GAS: D1 rises above the last upper Bollinger band and the last high: 0.644. This level can be used as an entry point. Initial risk limitation is possible below the Parabolic signal, the last three lower fractals, the 11-month low and the lower Bollinger line: 0.486. After opening a pending order, move the stop following the Bollinger and Parabolic signals to the next fractal low. Thus, we change the potential profit/loss ratio in our favor. The most cautious traders, after making a deal, can go to the four-hour chart and set a stop-loss, moving it in the direction of movement. If the price overcomes the stop level (0.486) without activating the order (0.644), it is recommended to delete the order: there are internal changes in the market that were not taken into account.
Fundamental Analysis of PCI - Oil vs Gas
In this review, we suggest looking at Personal Composite Instrument (PCI) & SumOIL/GAS. It reflects the price dynamics of a portfolio of two crude oil futures - Brent and WTI versus natural gas futures. Will the SumOIL/GAS quotes go up?
This movement means that oil is getting more expensive and natural gas is getting cheaper. U.S. The Energy Information Administration (EIA) expects to increase natural gas production from shale fields in November 2021 by 257 million cubic feet per day. The EIA also projects an average US natural gas price of $ 5.67 MMBtu (million British thermal units) for the winter period from October 2021 to March 2022. This is slightly above the current level. Starting from the 2nd quarter of 2022, EIA expects gas prices to decline by about 30% to $ 4.01 MMBtu, on average, by the end of next year. This could be facilitated by an increase in production to 96.4 billion cubic feet per day compared to 92.6 billion cubic feet per day this year. The main reason for the current rise in the price of American gas was the increase in LNG (LNG) exports. At the same time, growth in consumption within the United States is expected to be only 2% compared to last year. This forecast contributed to the correction of gas quotes. However, further on, their dynamics will mainly depend on the temperature in winter and the growth rate of production in the United States, as well as on the demand for LNG in Asian countries. The rise in world oil prices was driven by a slow increase in OPEC + production amid the global economic recovery after the coronavirus epidemic. On November 4, OPEC + will increase production by only 400 thousand barrels per day.
