Oil vs Gas Technical Analysis Summary
Above 0,433
Buy Stop
Below 0,333
Stop Loss
| Indicator | Signal |
|---|---|
| RSI | Buy |
| MACD | Buy |
| MA(200) | Neutral |
| Fractals | Neutral |
| Parabolic SAR | Buy |
| Bollinger Bands | Neutral |
Oil vs Gas Chart Analysis
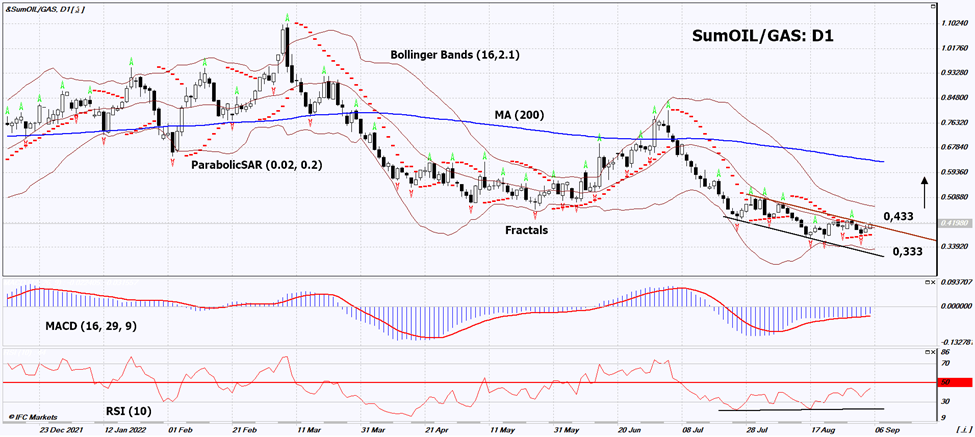
Oil vs Gas Technical Analysis
On the daily timeframe, SumOIL/GAS: D1 approached the downtrend resistance line. It must be broken up before opening a position. A number of technical analysis indicators formed signals for further growth. We do not rule out a bullish movement if SumOIL/GAS: D1 rises above its latest up fractal: 0.433. This level can be used as an entry point. Initial risk cap is possible below the Parabolic signal, the lower Bollinger band and the last 4 lower fractals: 0.333. After opening a pending order, we move the stop following the Bollinger and Parabolic signals to the next fractal low. Thus, we change the potential profit/loss ratio in our favor. The most cautious traders, after making a trade, can switch to a four-hour chart and set a stop loss, moving it in the direction of movement. If the price overcomes the stop level (0.333) without activating the order (0.433), it is recommended to delete the order: there are internal changes in the market that were not taken into account.
Fundamental Analysis of PCI - Oil vs Gas
Let’s review the Personal Composite Instrument (PCI) &SumOIL/GAS. It reflects the price dynamics of a portfolio of futures for two brands of oil - Brent and WTI against natural gas futures. Will the SumOIL/GAS quotes go up?
OPEC+ has decided to cut oil production in October by 100,000 bpd. At the same time, it will return to the level of August this year and remain at the pre-coronavirus level. The main reason for the decline in production was the emerging slowdown in global economic growth, which could have a negative impact on oil demand. Another factor could be the introduction of a coronavirus lockdown in the Chinese city of Chengdu. Stabilization of oil quotes may support the increase (correction) &SumOIL/GAS, as oil is far behind natural gas in growth. Over the past 12 months, Brent has risen in price by 30.5%, WTI - by 27.6%. During the same time, the price of Natural Gas Futures soared 90.3%. Against this background, &SumOIL/GAS at the end of August fell to the lows of the coronavirus epidemic in April 2020 and the global economic crisis in 2008.