Another Cloud cloud computing name that has vastly outperformed the market since March 2020 low, is none other than OKTA. This name has been a solid performer since the IPO, and remains favoured to extend higher in its bull trend in the long term. Lets take a look at what the company does:
“ Okta, Inc. is an identity and access management company based in San Francisco. It provides cloud software that helps companies manage and secure user authentication into modern applications, and for developers to build identity controls into applications, website web services and devices. It was founded in 2009 and had its initial public offering in 2017, being valued at over $6 billion.
Okta sells six services, including a single sign-on solution that allows users to log into a variety of systems using one centralized process. For example, the company claims the ability to log into Gmail, Workday, Salesforce and Slack with one login. Okta’s services are built on top of the Amazon Web Services cloud."
There is nothing to dislike about the OKTA chart, in fact it has had a steady uptrend since the IPO. Lets take a more in depth look at the daily view below.
OKTA Daily Elliott wave View:
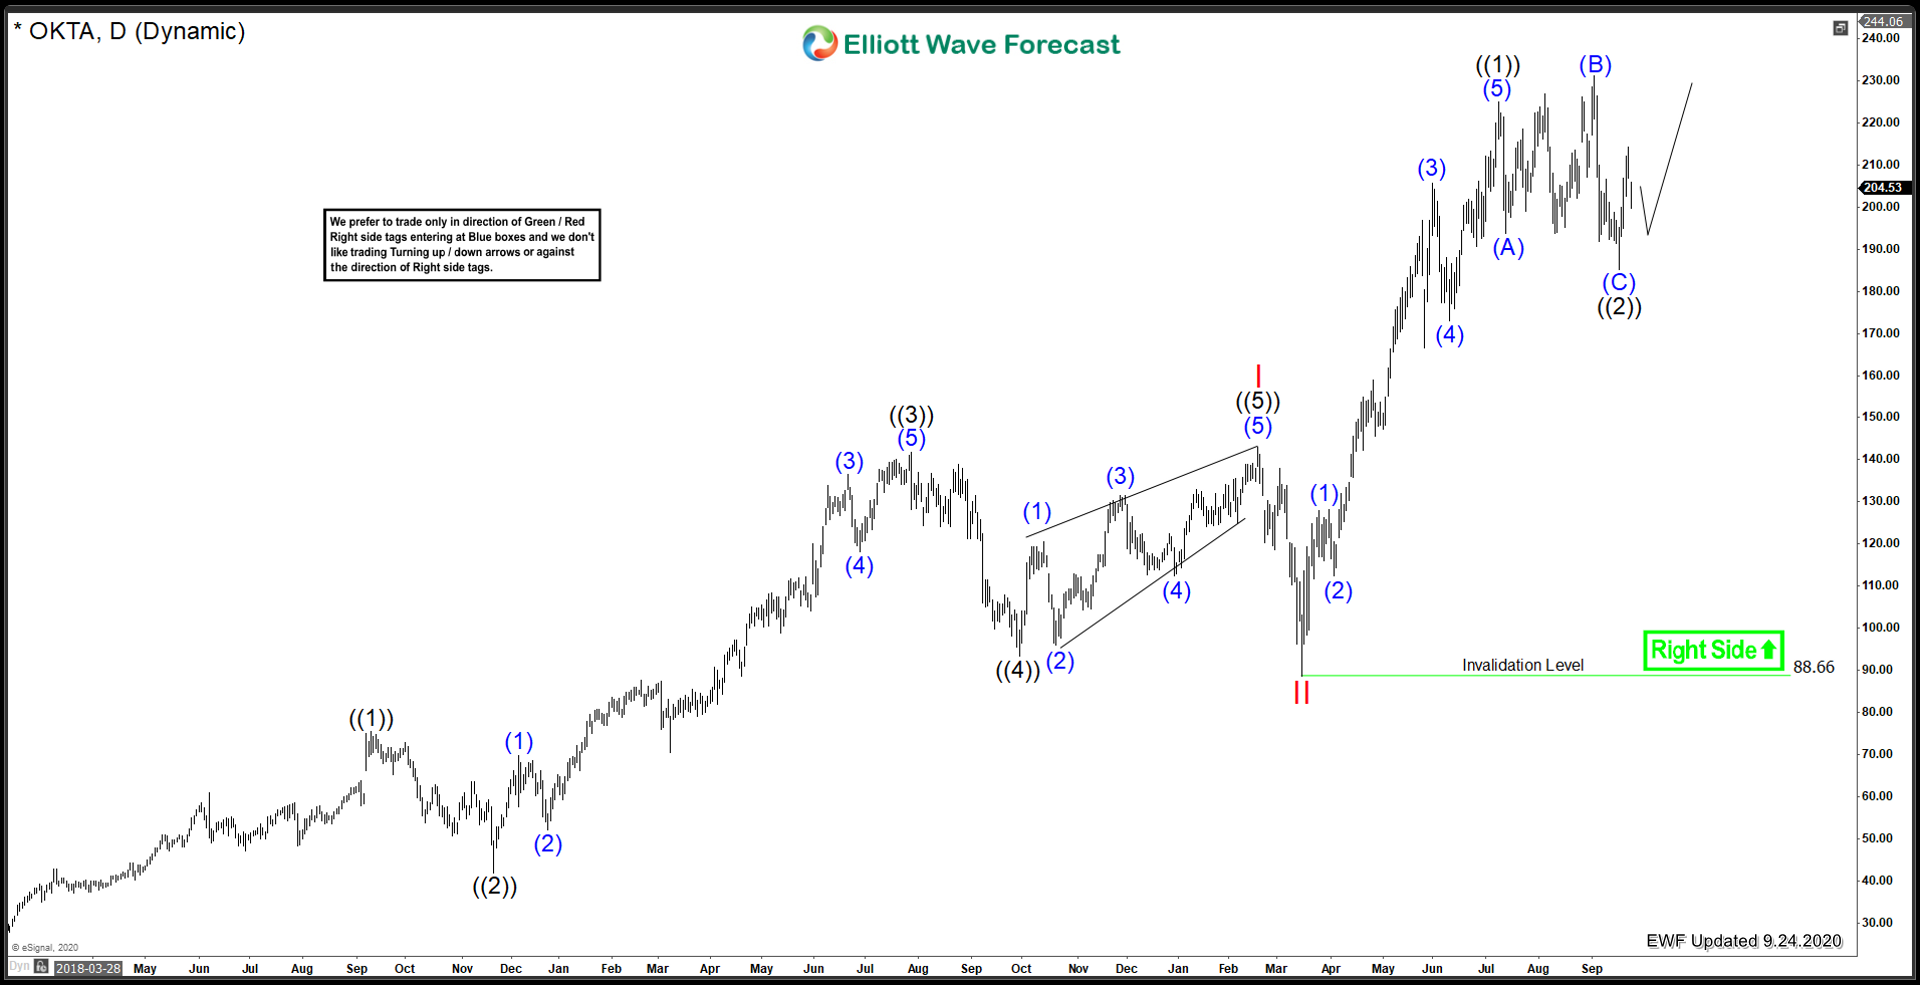
On a daily Time Frame. From the all time lows, OKTA features a clear 5 waves structure in the Red I Feb 2020 peak. From there a red II low has taken place along with many other instruments in the market place. There are certain companies that have outer performed off the March 2020 low. Those are the ones that are best focused on for long term gains. From an elliottwave standpoint, this chart has a beautiful structure that favours further gains in the future. In the long term, as long as the 88.66 low remains intact, further upside is likely to take place. OKTA is favoured to have completed a 5 waves impulse from the March 2020 low, and corrected in a nesting wave ((2)).
OKTA 4H Elliott Wave View:
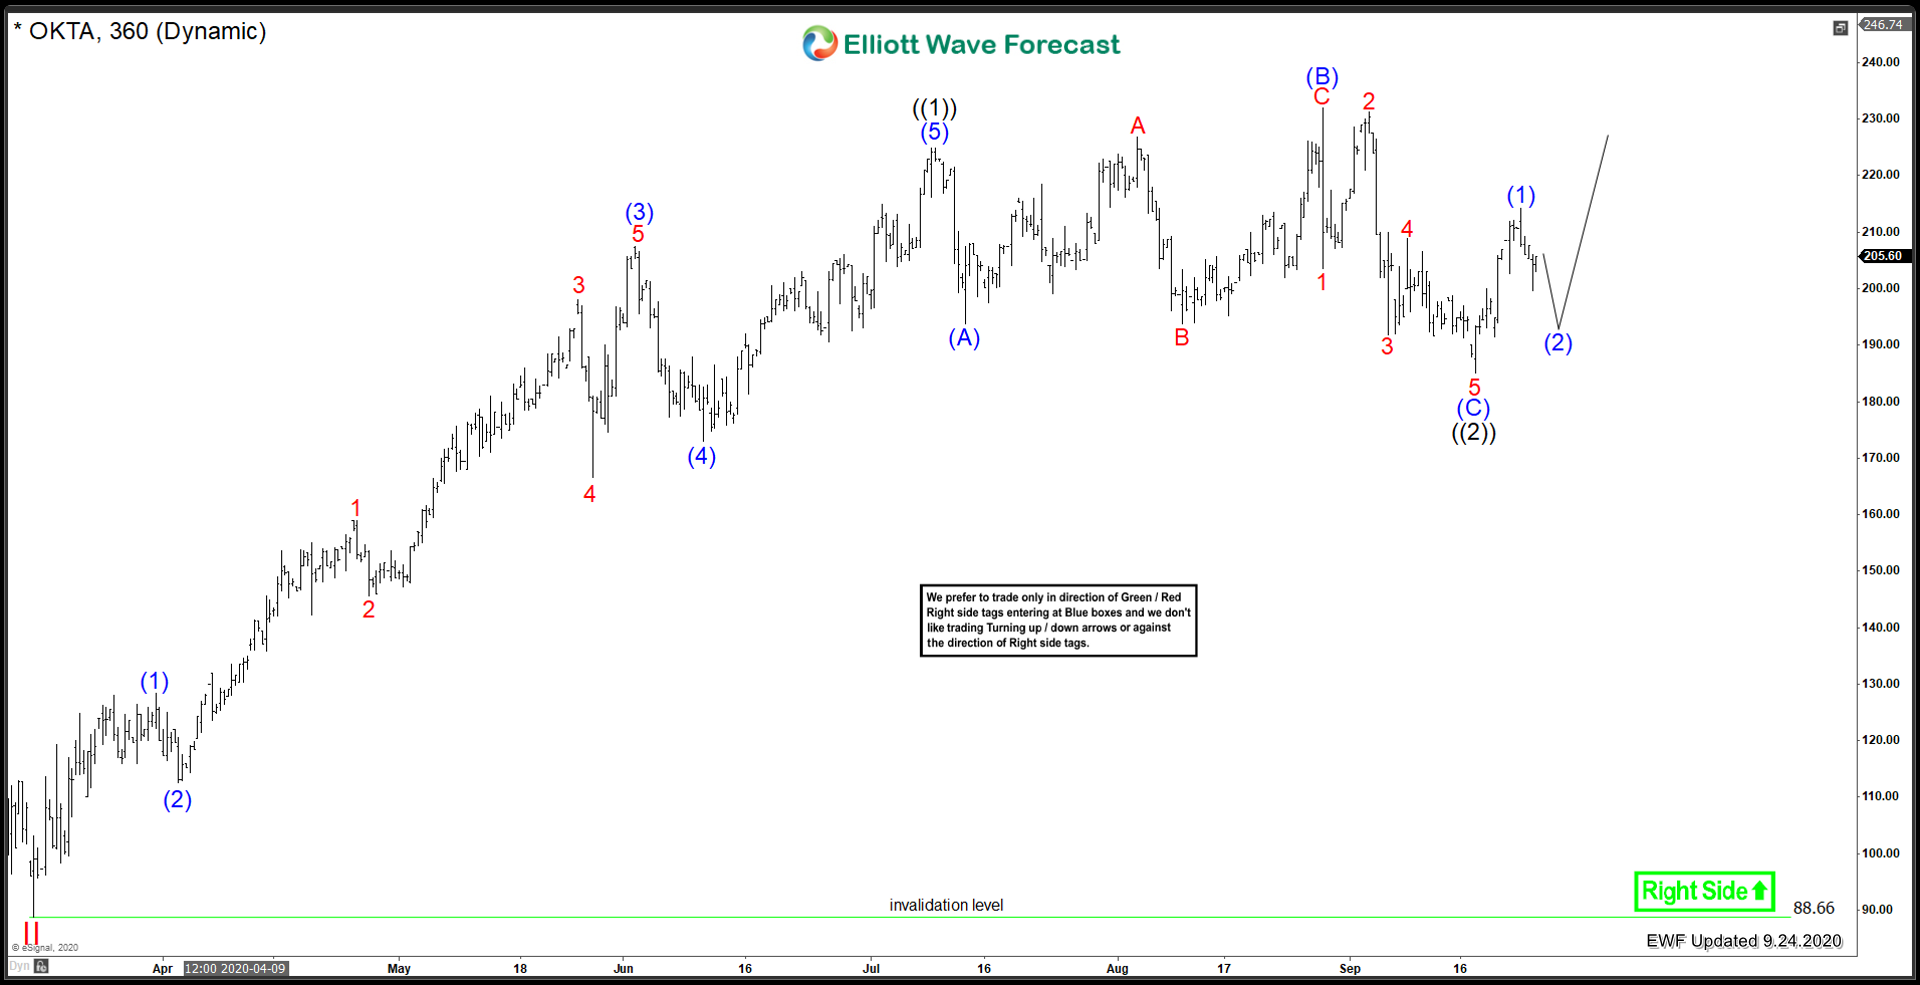
On a 4H view, from the Red II Low, 5 waves impulse is complete for Black ((1)) on July 9/2020 at 224.90 . After that impulse took place, the price structure has been largely sideways and choppy. The Black ((2)) correction has taken shape in an expanded flat correction. As long as the recent low at ((2)), 185.05, remains intact, we can expect this instrument to continue upside extension. If that level gets invalidated, it could be favoured that ((2)) correction is still underway, but the view would remain bullish in the long term.
In conclusion, black ((2)) is favoured to be set as long as those 185.05 lows remain intact. Ultimately, while above the Red II low 88.66, we remain bullish and favour further upside to take place.