Orange Juice Technical Analysis Summary
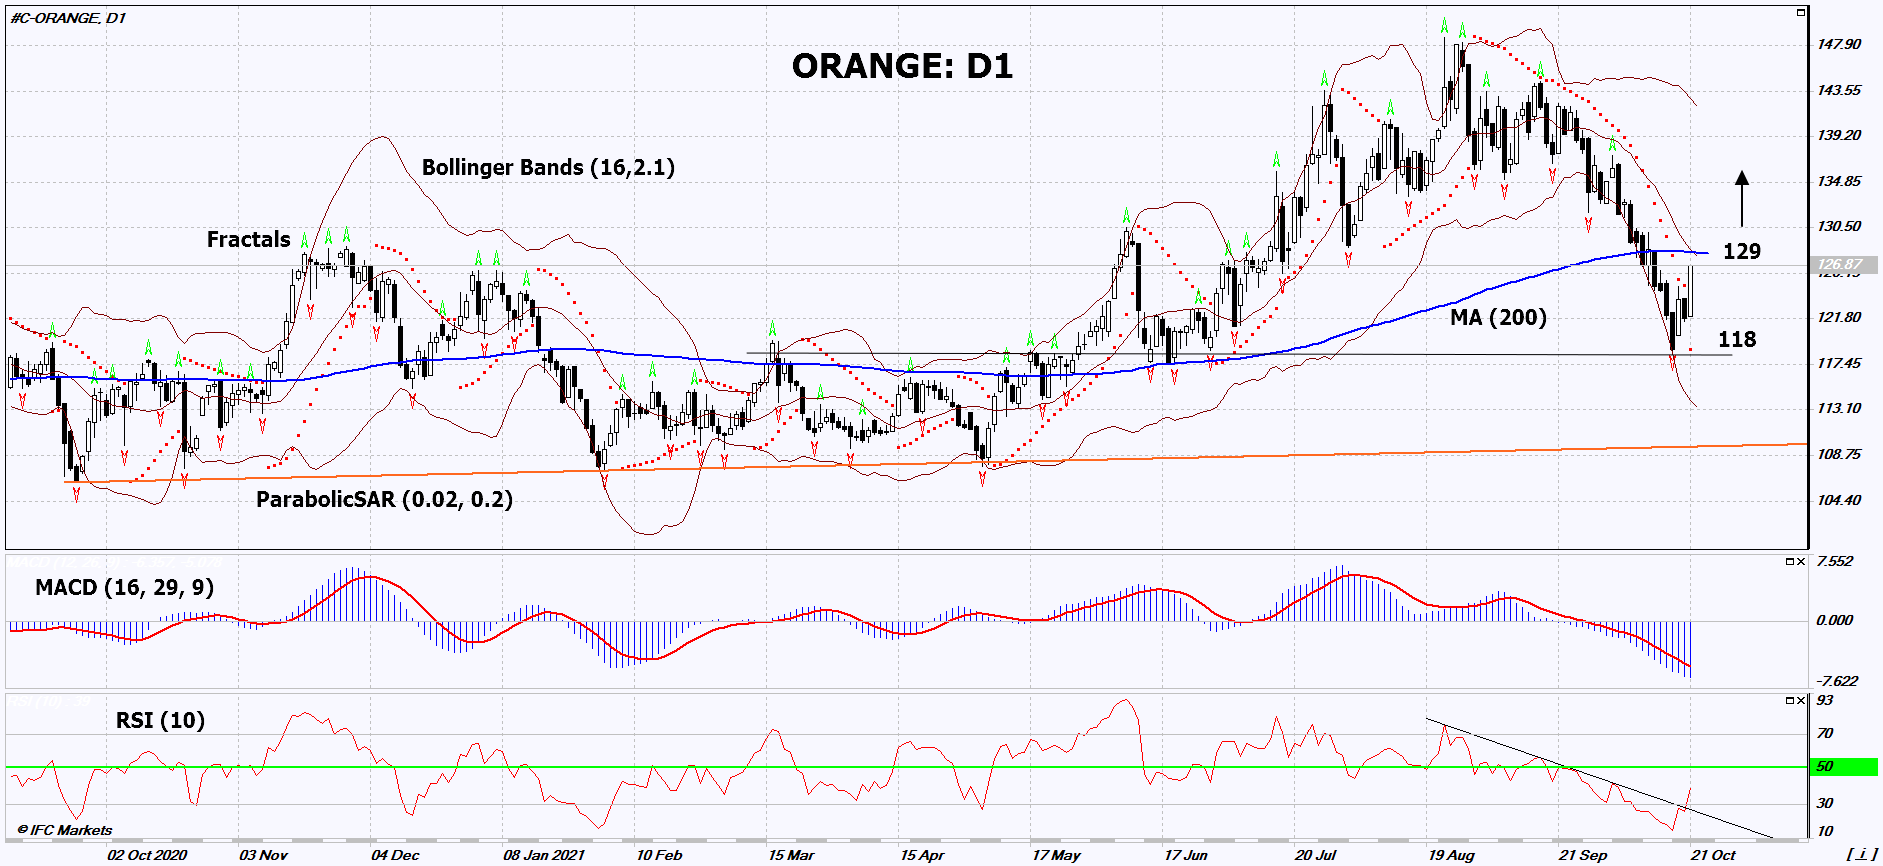
Buy Stop: Above 129
Stop Loss: Below 118
| Indicator | Signal |
|---|---|
| RSI | Neutral |
| MACD | Sell |
| MA(200) | Neutral |
| Fractals | Neutral |
| Parabolic SAR | Buy |
| Bollinger Bands | Neutral |
Orange Juice Chart Analysis
Orange Juice Technical Analysis
On the daily timeframe, ORANGE: D1 has not yet turned upward. A buy signal may appear if the 200-day moving average line is exceeded. Several technical analysis indicators have generated signals for further upside. We do not rule out a bullish movement if ORANGE rises above the 200-day moving average line: 129. This level can be used as an entry point. The initial risk limitation is possible below the Parabolic signal and the lower Bollinger line: 118. After opening a pending order, move the stop following the Bollinger and Parabolic signals to the next fractal low. Thus, we change the potential profit/loss ratio in our favor. The most cautious traders, after making a deal, can go to the four-hour chart and set a stop-loss, moving it in the direction of movement. If the price overcomes the stop level (118) without activating the order (129), it is recommended to delete the order: there are internal changes in the market that were not taken into account.
Fundamental Analysis of Commodities - Orange Juice
In the US, the citrus crop is expected to decline. Will the ORANGE quotes grow?
The United States Department of Agriculture (USDA) expects a 12% drop in orange harvest in the 2021/2022 agricultural season from 2020/2021 to 3.88 million tonnes. In the state of Florida, the harvest may decrease by 11% and in California - by 13%. Recall that in the current season 2020/2021, orange production in the United States also decreased compared to the 2019/2020 season - by 15%.