Since the crash of March 2020, all stocks have tried to recover what they lost and P&G was no exception. P&G did not only recover the lost, but It also reached historic highs. Now, we are going to try to build an impulse from wave II with a first target to $154.00 next $167.50 and $174.00.
P&G Daily Chart
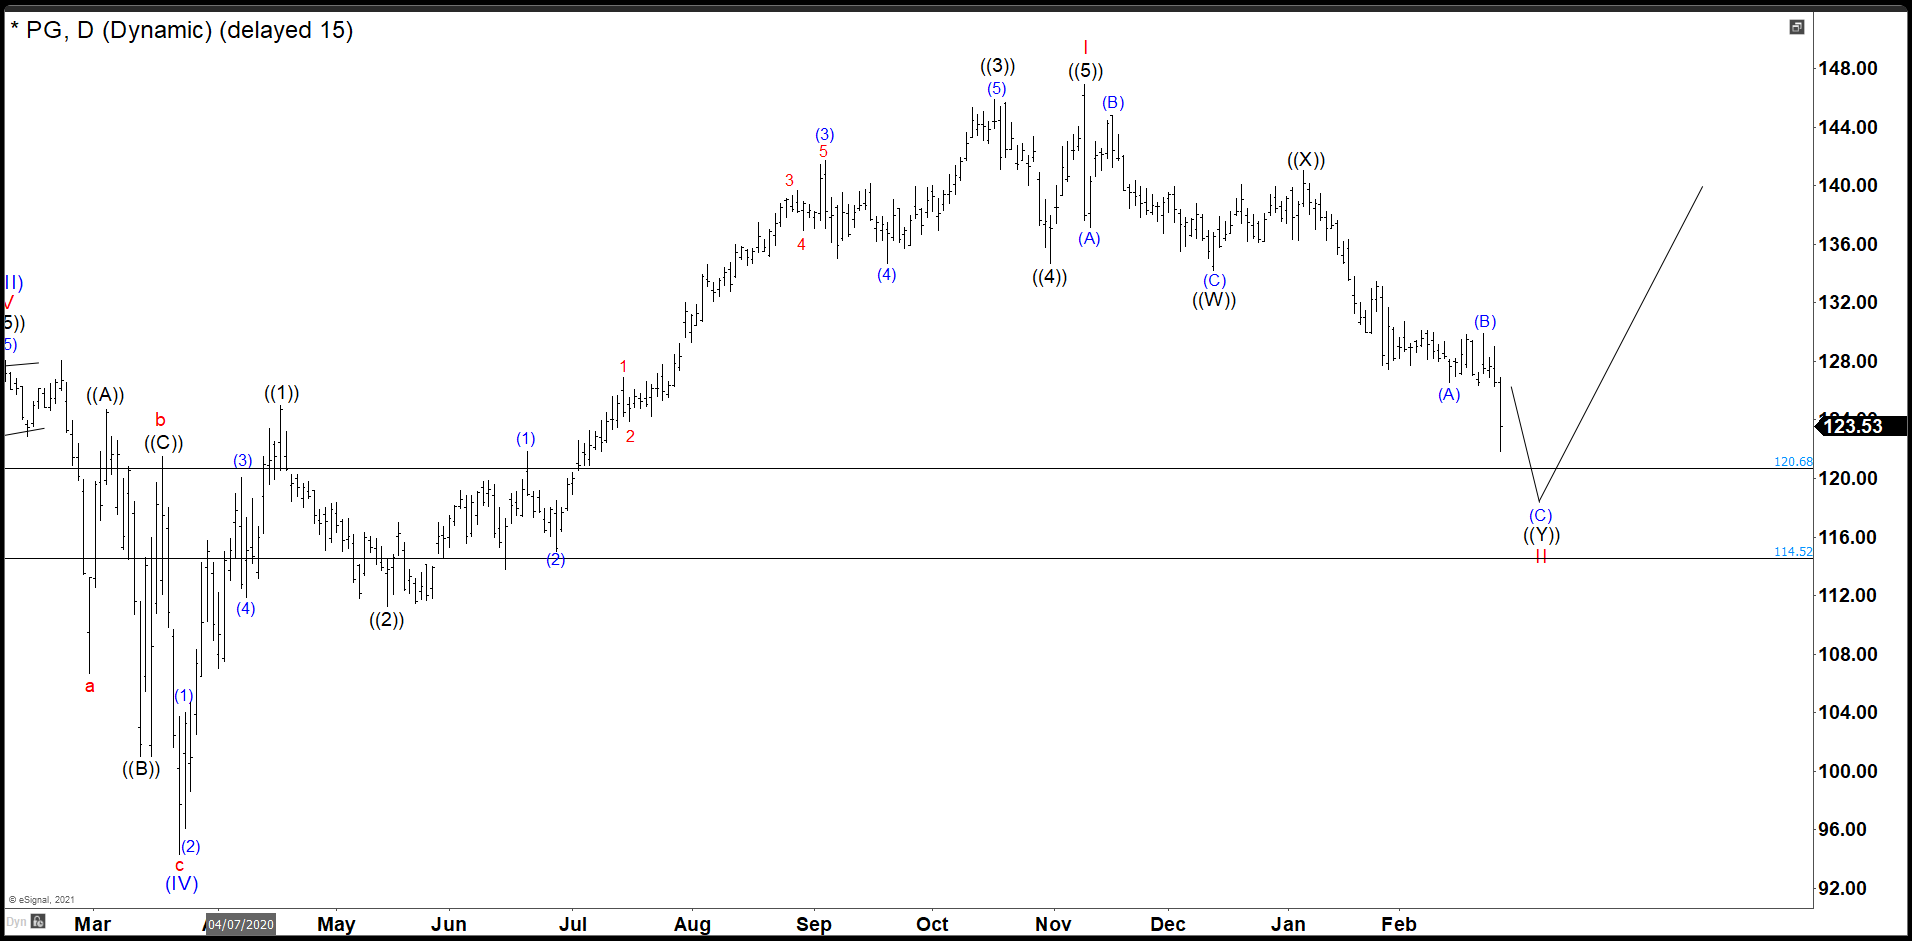
As we see in the daily chart, P&G built an impulse ((1)), ((2)), ((3)), ((4)), and ((5)) that we call I in red and it ended at 146.92. Since November, the stock has dropped only. We see 3 waves down ((W)), ((X)) and we were looking for a little more lower to complete wave ((Y)) and II, as a double correction, to 120.68 – 114.52 area. (If you want to learn more about Elliott Wave Theory, please follow this link: Elliott Wave Theory).
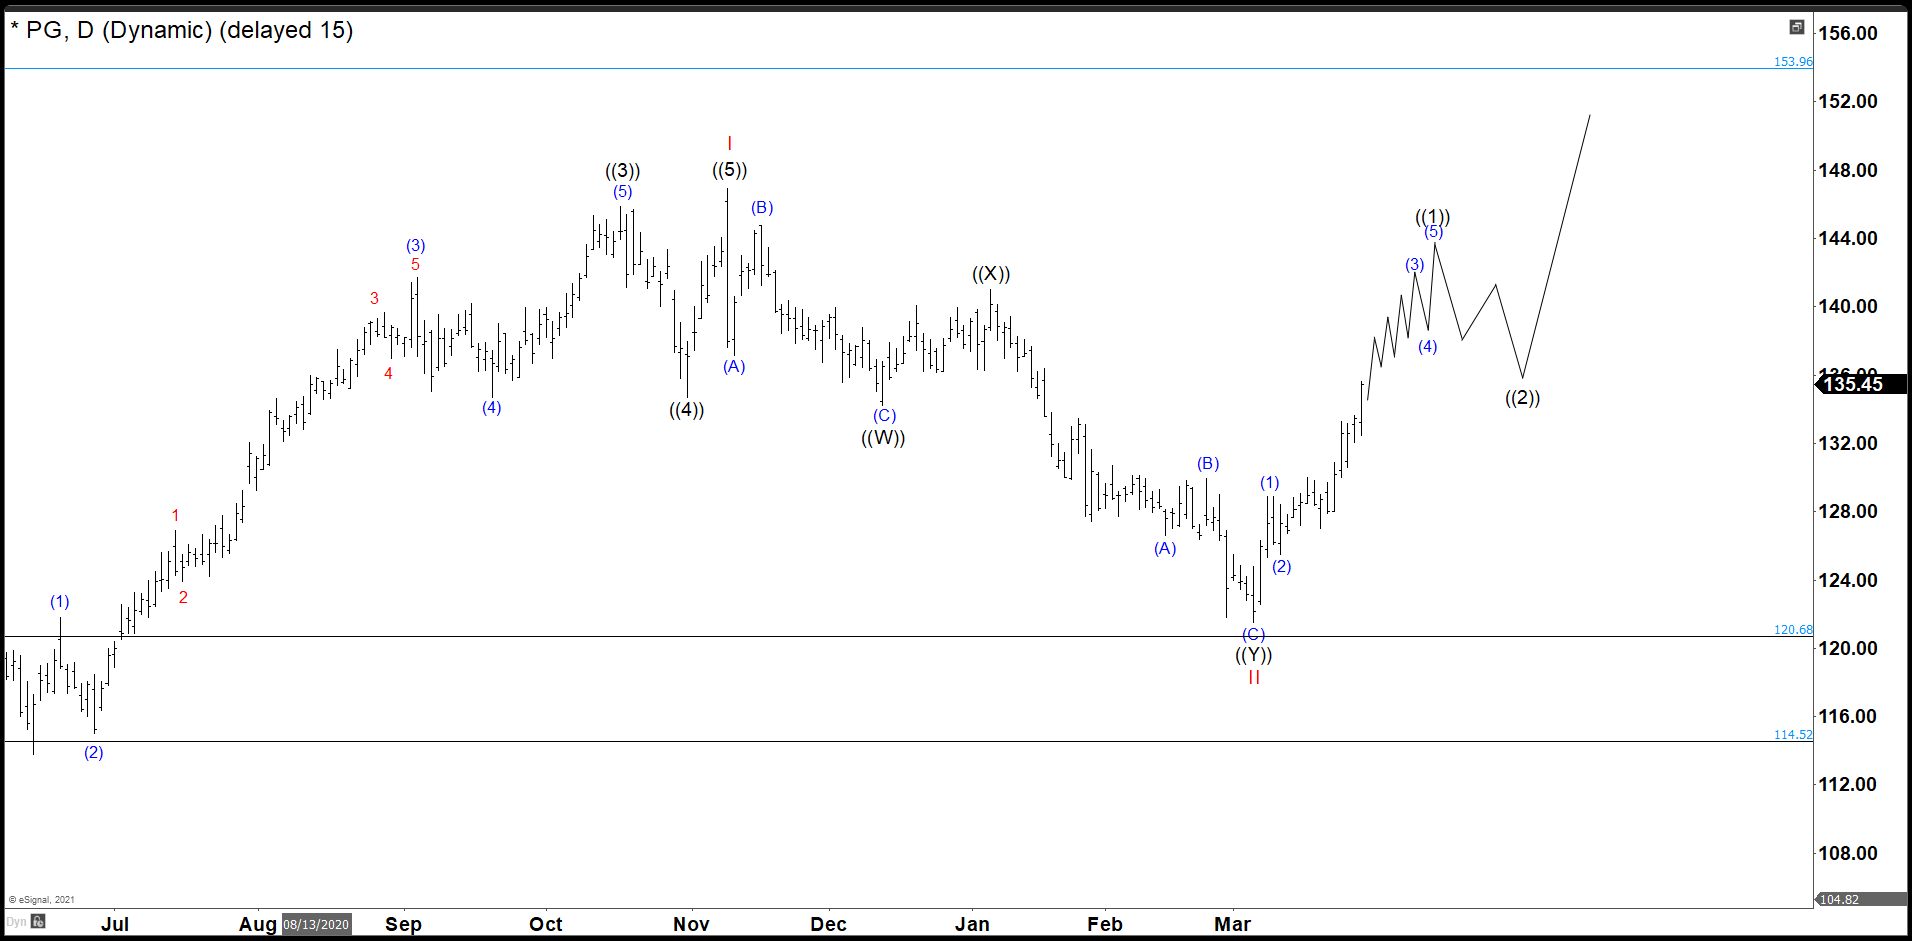 The market made a new low, but it was not enough to reach the area and bounced from 121.54 dollars. The rally has been interesting and it should continue higher to complete wave ((1)). Our first target now is 154.00 dollars.
P&G 30 minutes Chart
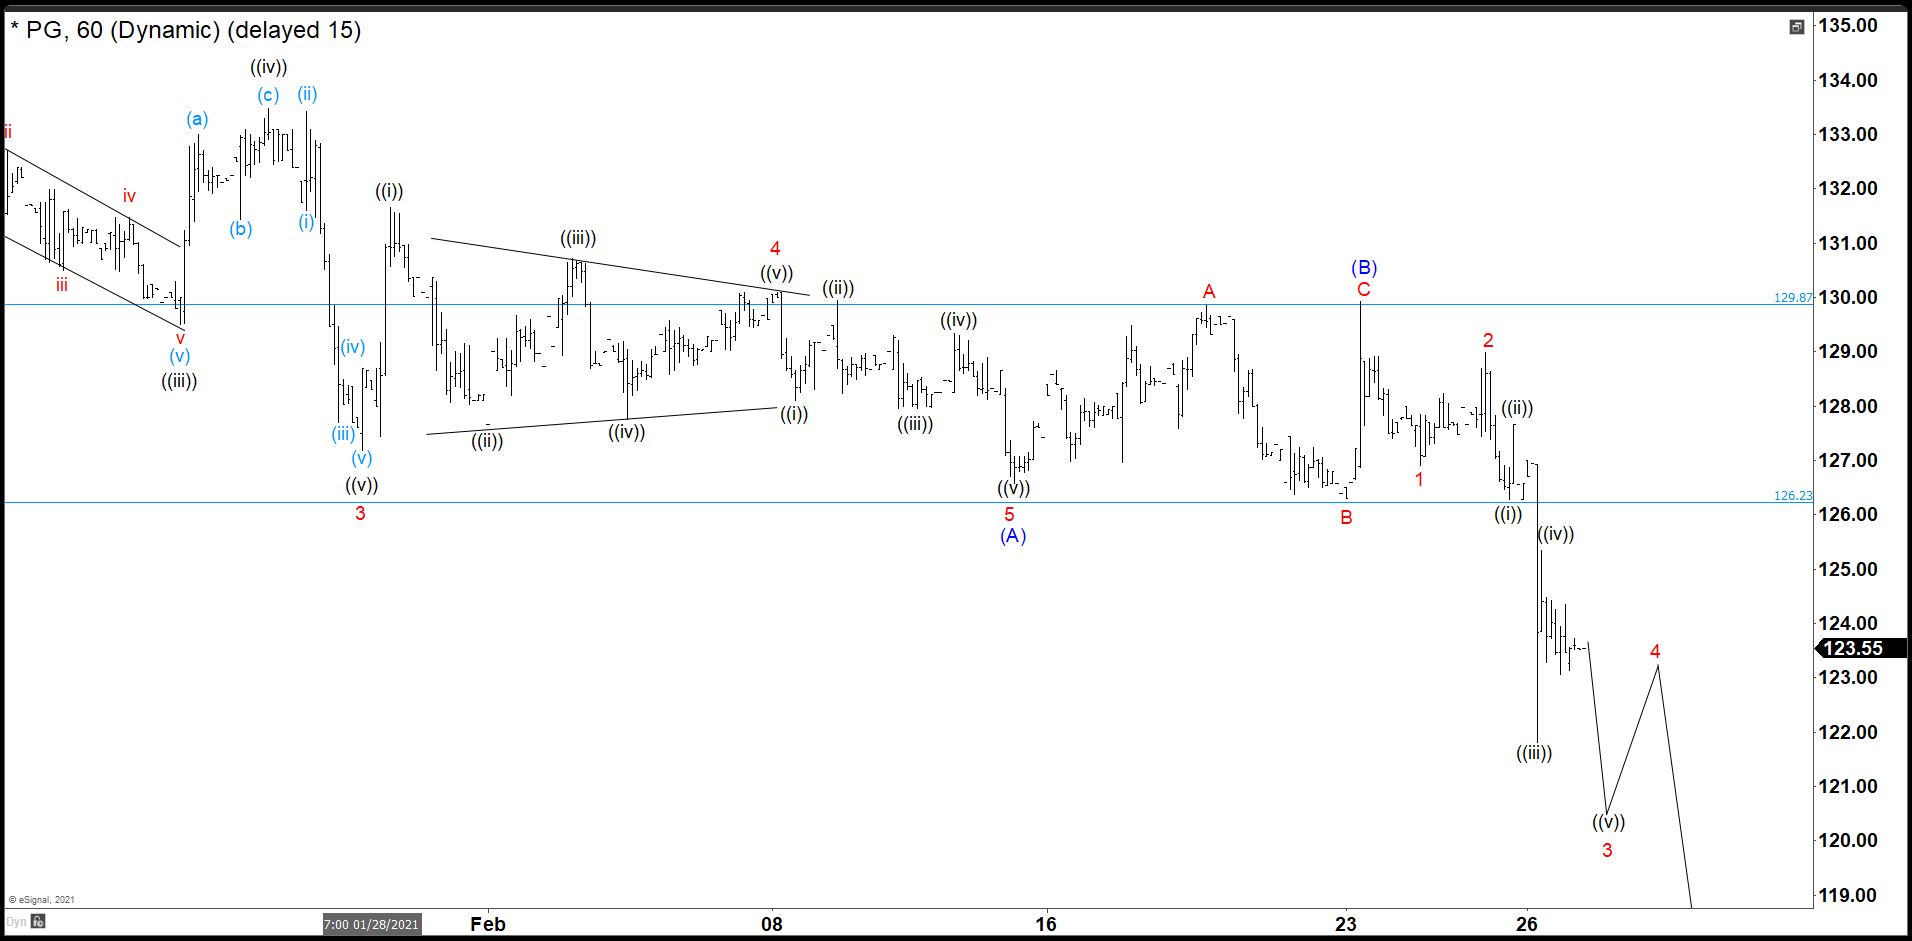
In the beginning of March, we were expecting 2 lows more to complete wave ©, ((Y)) and II, but P&G just made one and rebounded nicely.
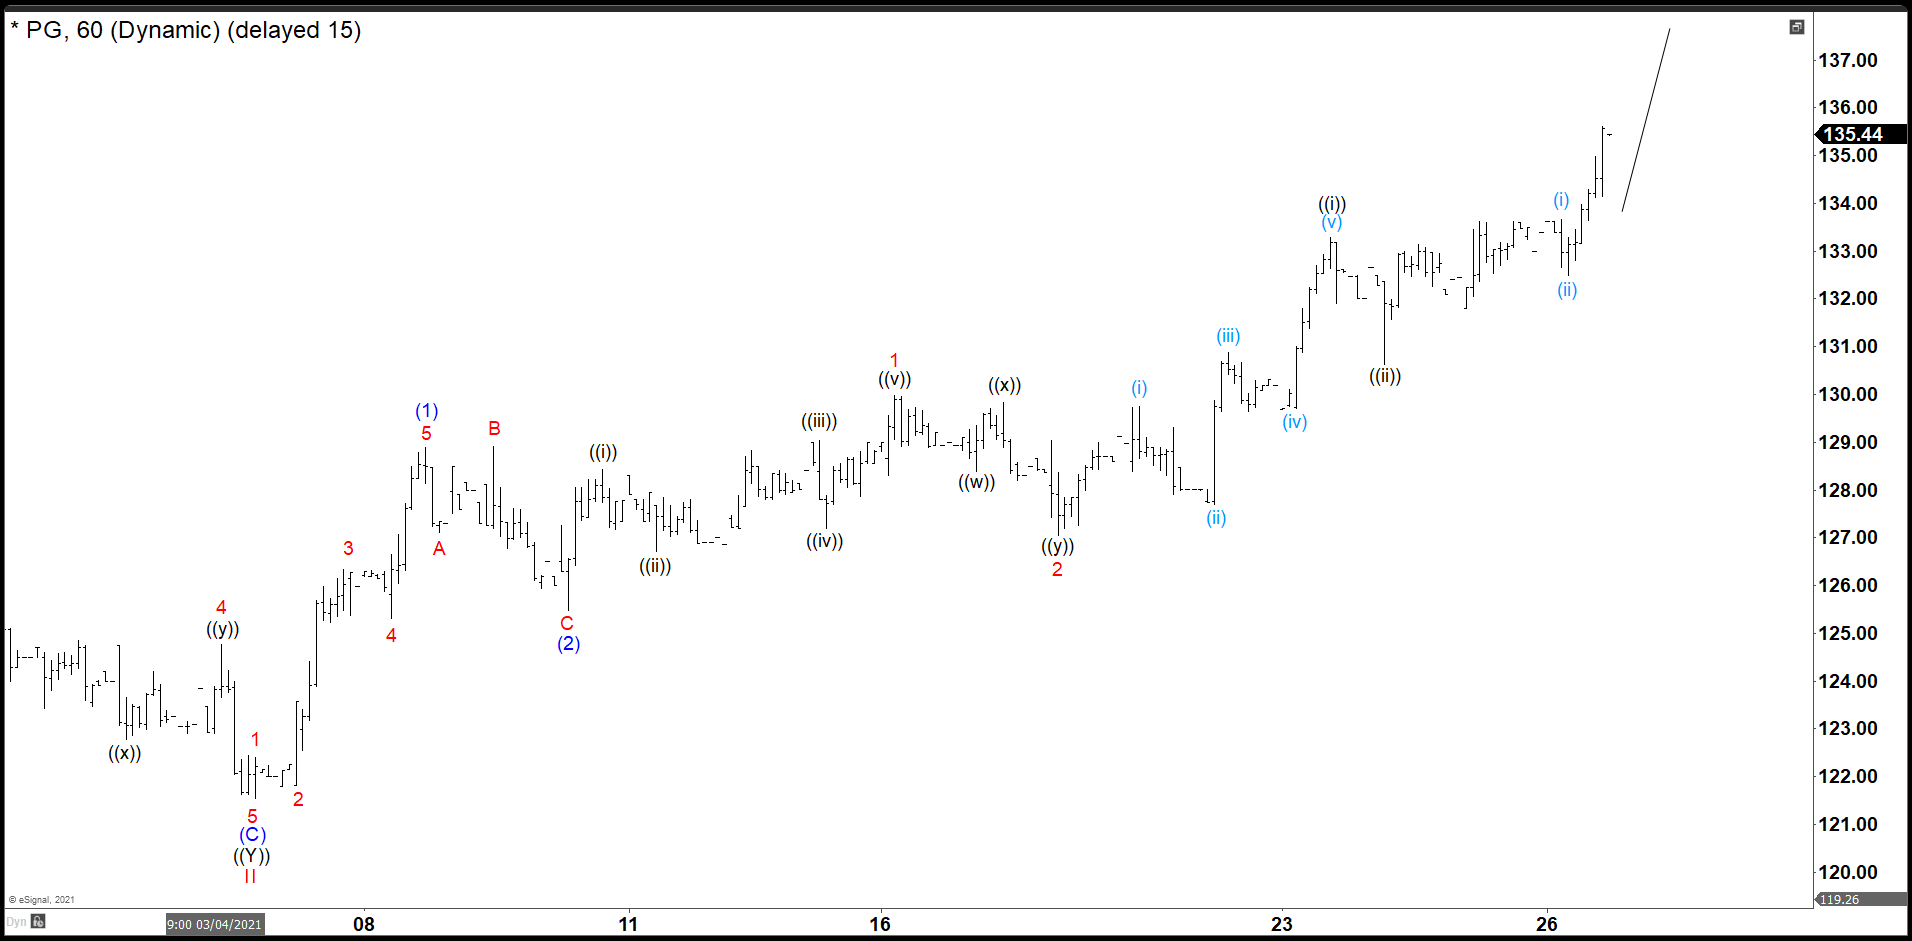
From the bottom, P&G developed impulse after impulse making a nest. That means we need to continue with the uptrend until we find out some separation to determinate where the first wave (iii) is going to end. In this week we should see this move to the upside on Monday and then continue going up with divergences until wave ((1)) completes.
Source: P&G Bounced Nicely Missing The Ideal Entry Area By Cents