Since the crash of March 2020, all stocks have tried to recover what they lost and P&G was no exception. P&G did not only recover the lost, but It also reached historic highs. Now, we are going to try to build an impulse from wave II with a first target to $154.00 next $167.50 and $174.00, depending how the structure is developing.
P&G Old Daily Chart
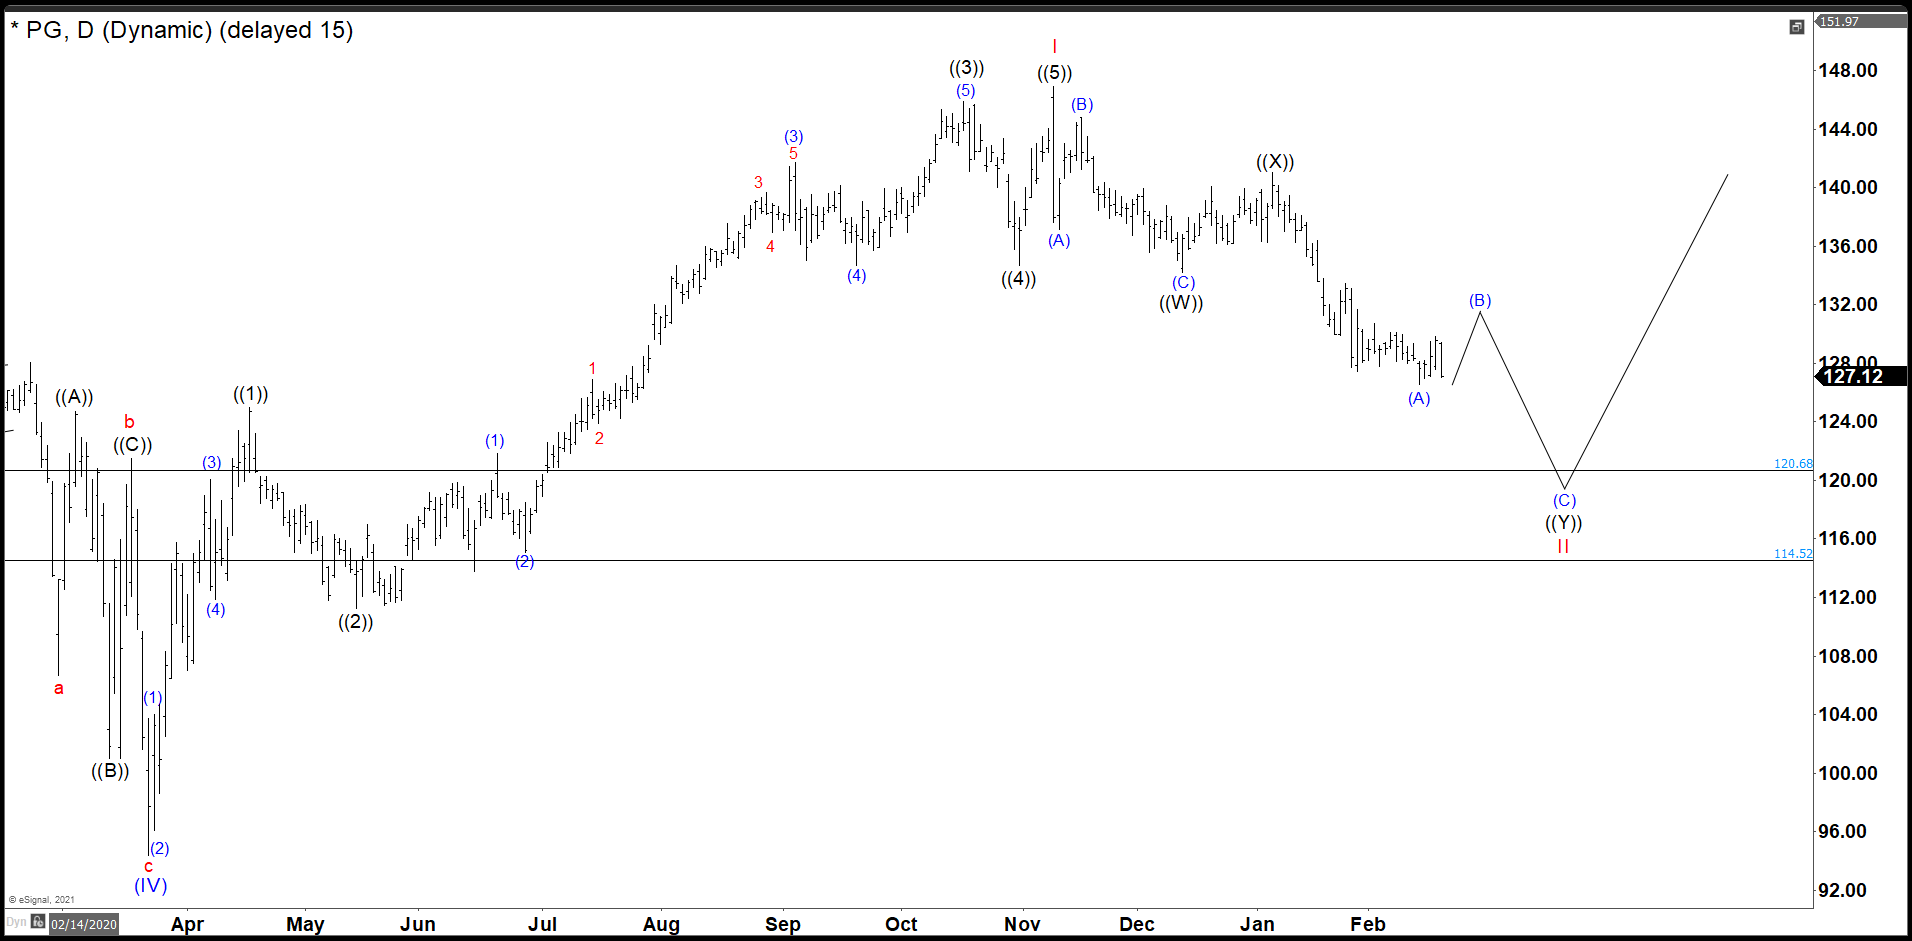 As we see in the daily chart, P&G built an impulse ((1)), ((2)), ((3)), ((4)), and ((5)) that we call I in red and it ended at 146.92. Then, the stock dropped in 7 swings down ((W)), ((X)) and ((Y)) forming a double correction as wave II.
P&G Last Month Daily Chart
This wave II bounced from 121.54 dollars missing our ideal level for a few cents at 120.68. (If you want to learn more about Elliott Wave Theory, please follow this link: Elliott Wave Theory).
P&G Daily Chart
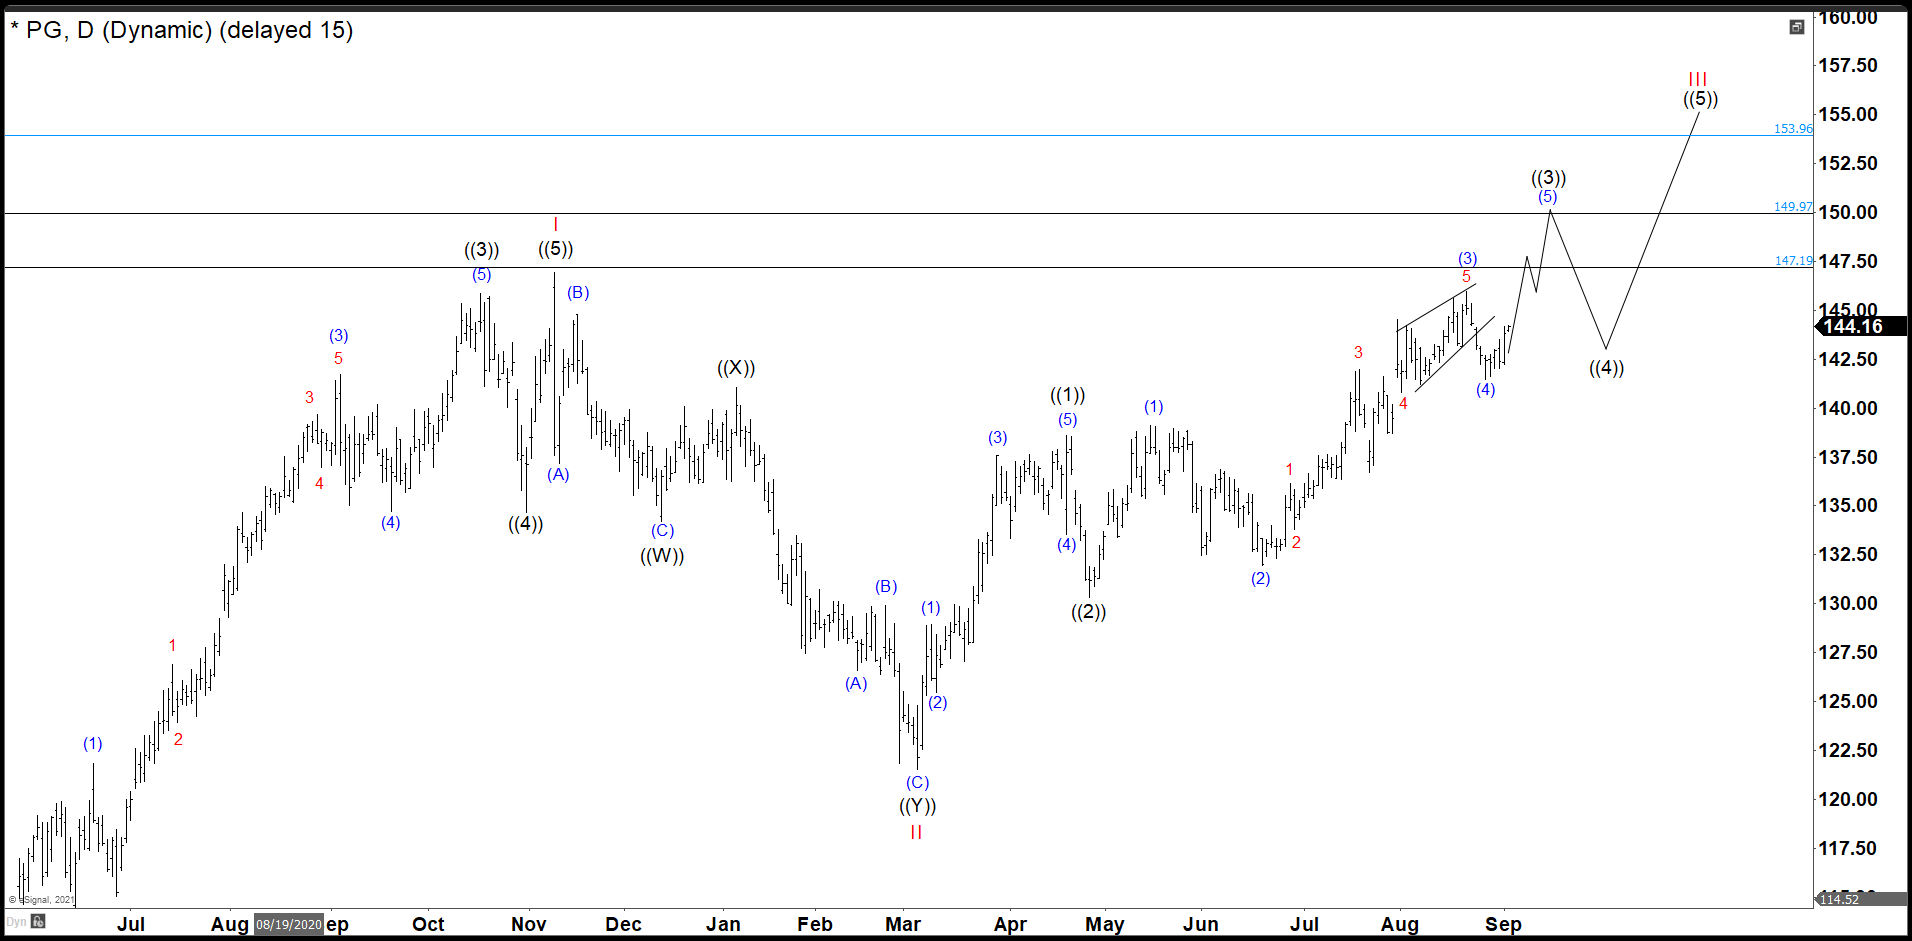
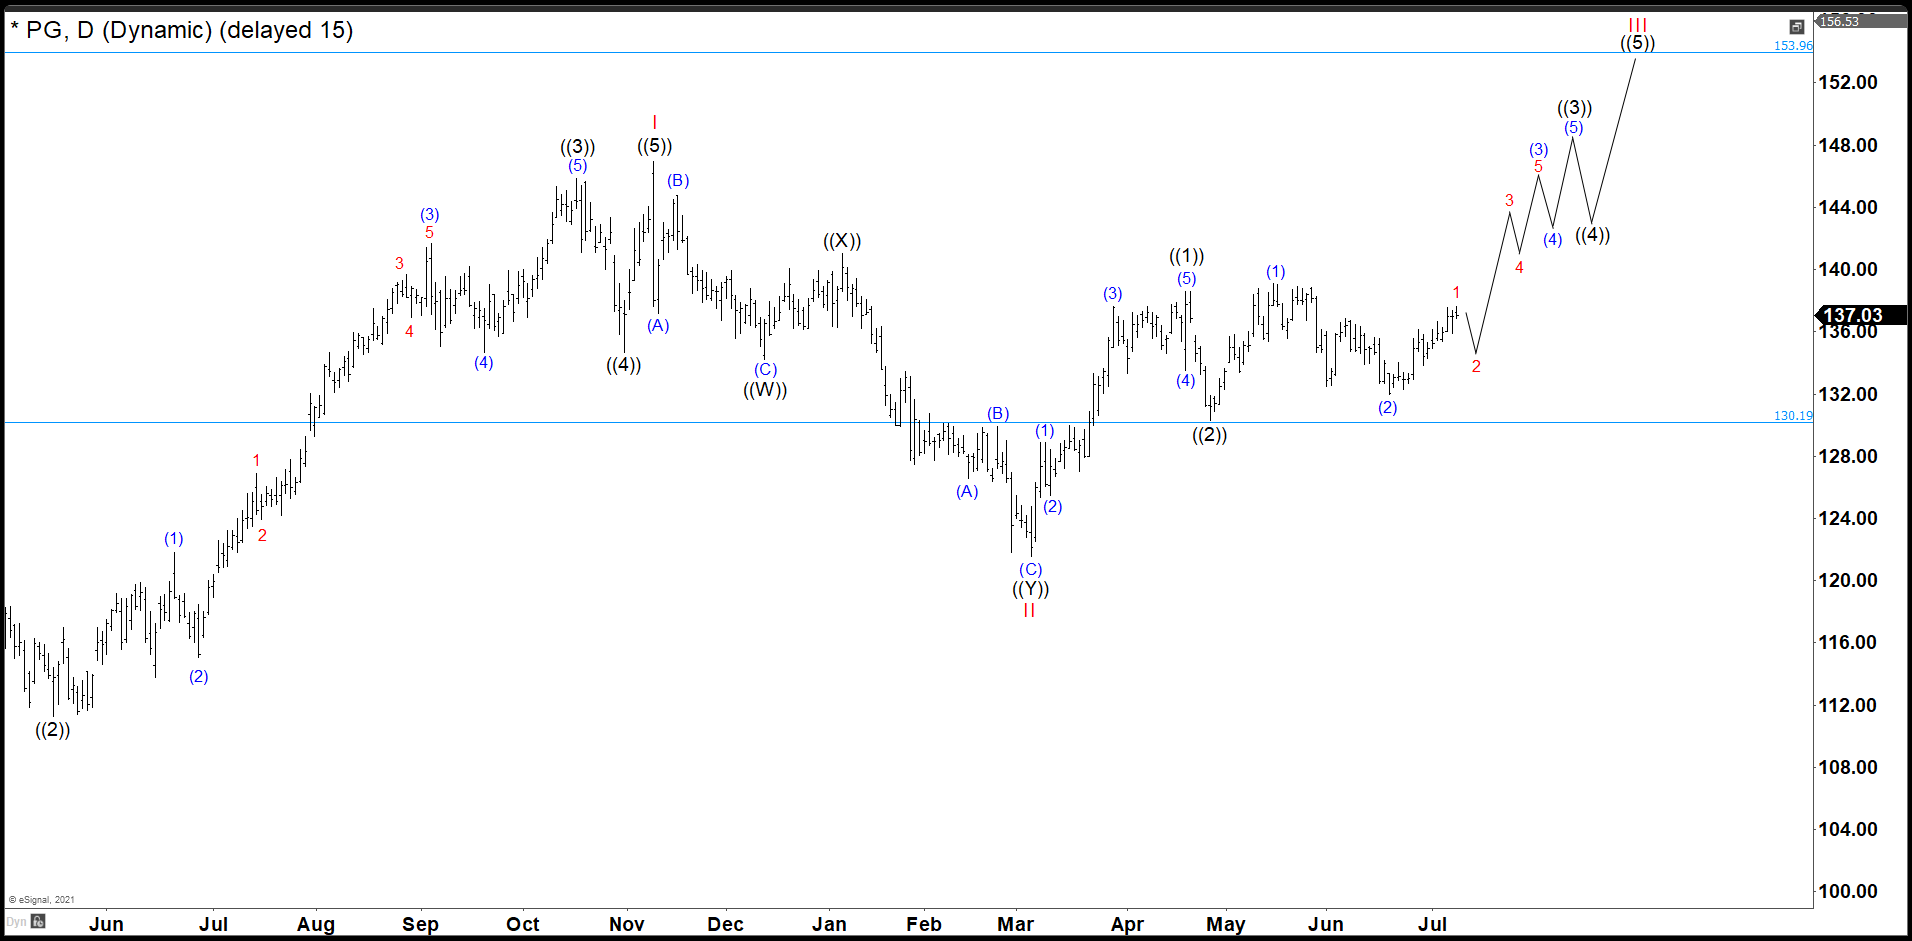
P&G rallied, and it completed wave ((1)) at 138.63 dollars. Also, we have seen a pullback that bounced at 130.19 dollars, Fibonacci 50% retracement, ending for us the wave ((2)). Wave (1) of ((3)) ends at 139.18 and wave (2) of ((3)) made a double correction to complete at 131.93. Wave (3) of ((3)) ended at 145.97 and wave (4) of ((3)) pullback completed at 141.47. As we stay above this level, we should continue higher to build a new impulse as wave (5) of wave ((3)) as you could see in the chart above. The target to complete wave ((3)) comes in 147.19 – 149.97 area. As Alt view, wave (4) of ((3)) is not done and it could breat 141.47 and then bounce to complete wave ((3)).
Source: P&G Is Developing An Impulse To Complete Wave ((3)) of III