Hello fellow traders. In this technical blog we’re going to take a quick look at the Elliott Wave charts of Palladium Futures, published in members area of the website. As our members know, the commodity has had incomplete bullish sequence in the cycle from 1056.56 low. The Elliott wave structure had been calling for further strength. Consequently, we advised members to avoid selling Palladium Futures and keep keep buying the dips in the sequences of 3,7,or 11 swings whenever opportunity presented itself. In further text we’re going to explain Elliott wave structure and trading setup.
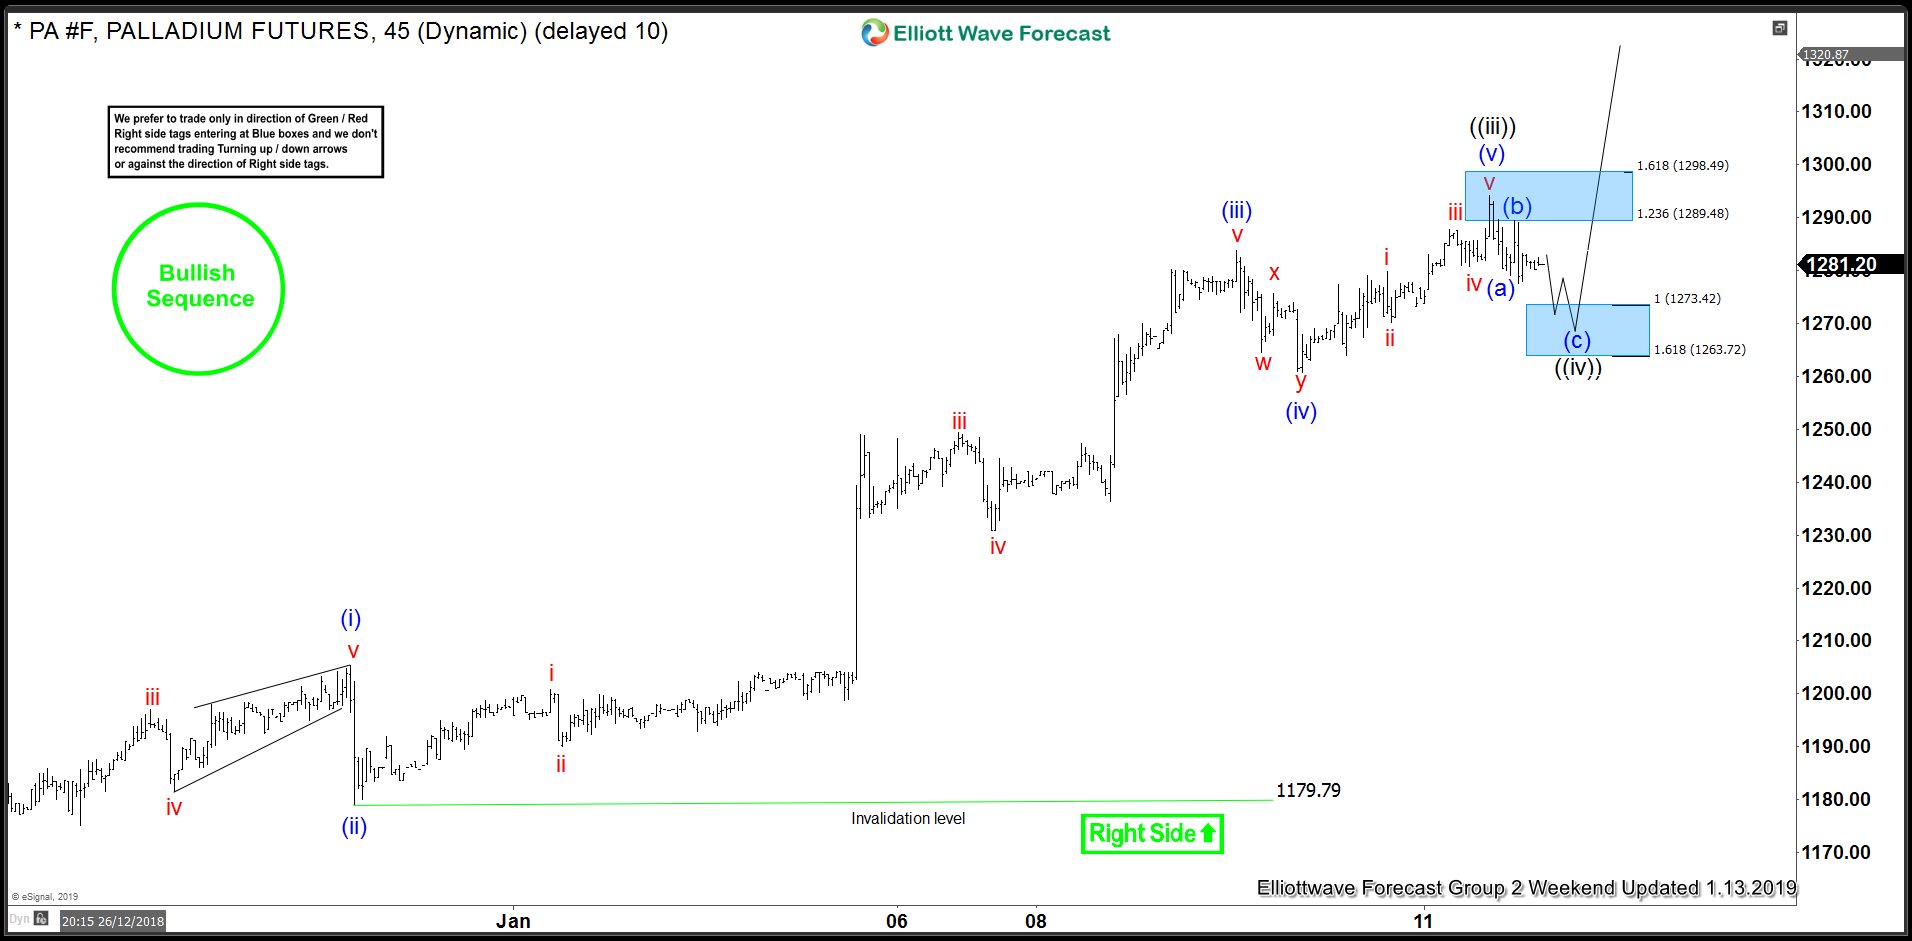
Palladium 1 Hour Elliott Wave Analysis 1.13.2019
As we can see on the chart below, Palladium is doing wave ((iv)) pull back, that is unfolding as (a)(b)© ZigZag Elliott Wave pattern. The commodity is bullish against the 1179.79 low in first degree, and we favor the long side. Short term pull back has scope to reach 1273.42-1263.72 area , where we like to be buyers for proposed rally or 3 wave bounce altneratively. Although we expect to see another leg down , we advise members to avoid selling against the main bullish trend. Strategy is waiting for mentioned area 1273.42-1263.72 to be reached, before entering long positions. As the main trend is bullish, we expect to see reaction in 3 waves up from the blue box at least. As soon as the bounce reaches 50 fibs against the (b) blue high, we will make long positions risk free and let the profit run.
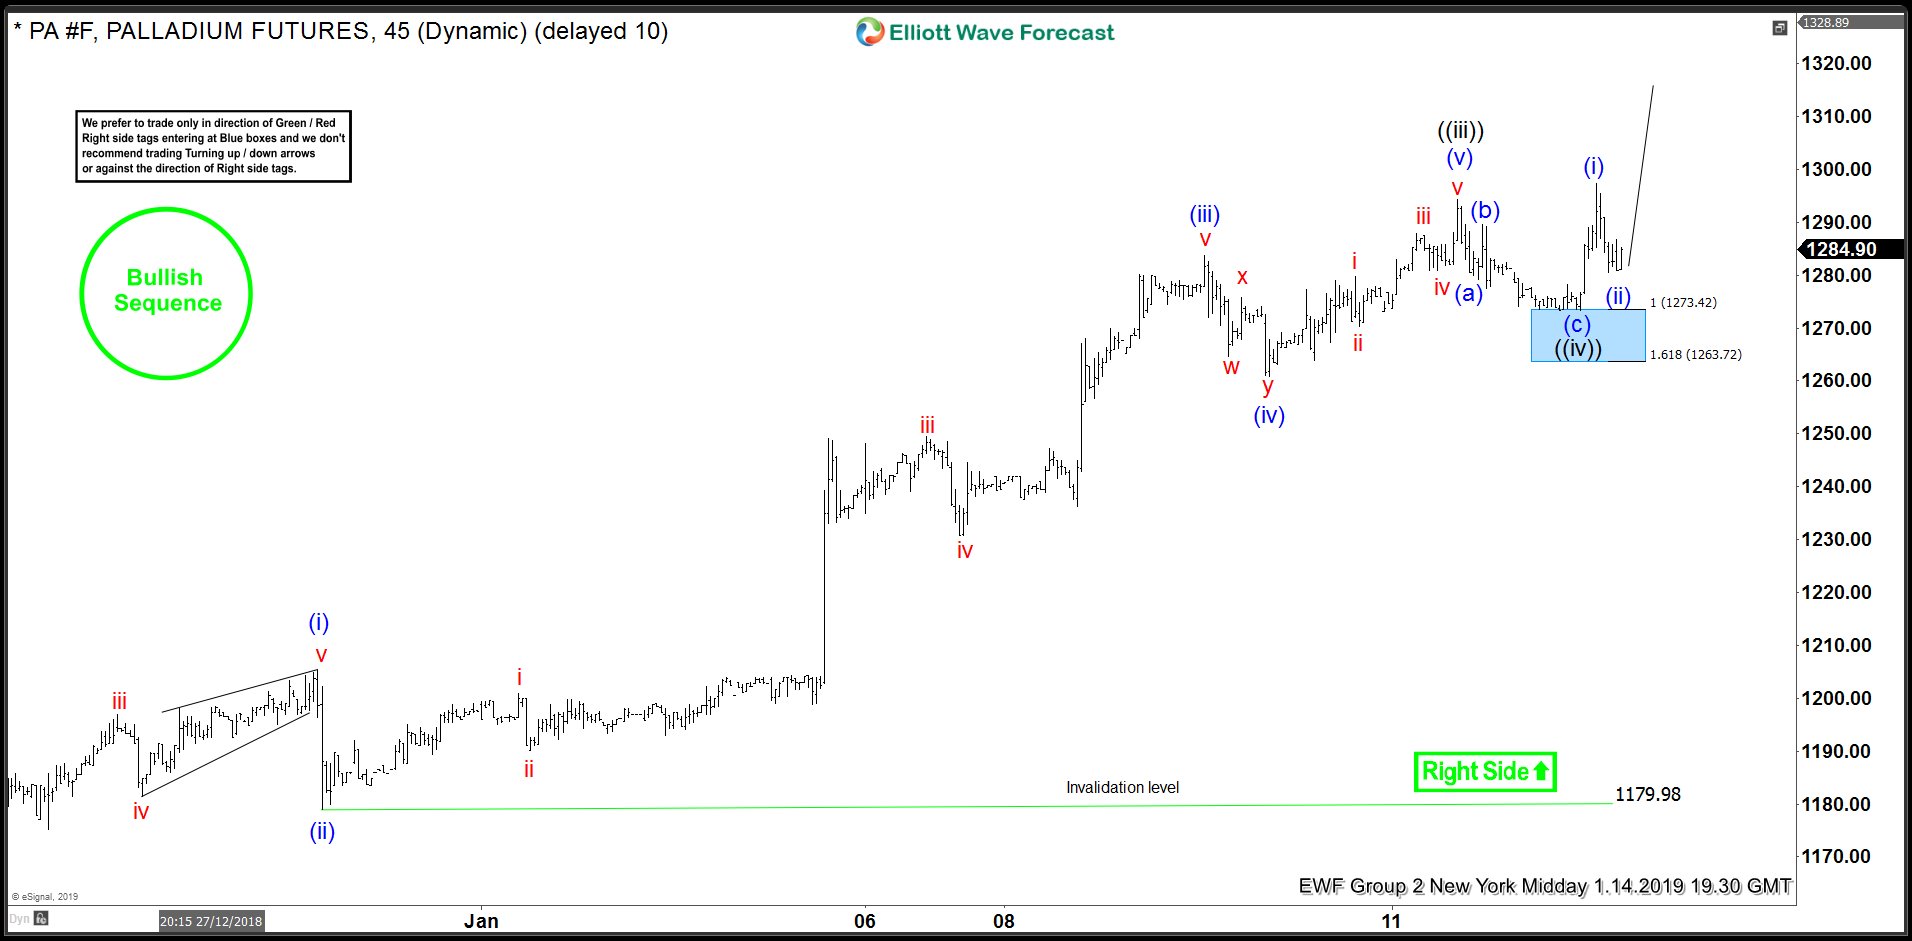
Palladium 1 Hour Elliott Wave Analysis 1.14.2019
Eventually Palladium has given us leg down toward blue box- buying zone. Buyers have appeared shortly after and we got turn higher, when pull back ended right at the upper end of the blue box. Now calling pull back completed and we already got the new high. As a result members who took long trades are now enjoying profits with risk free positions.
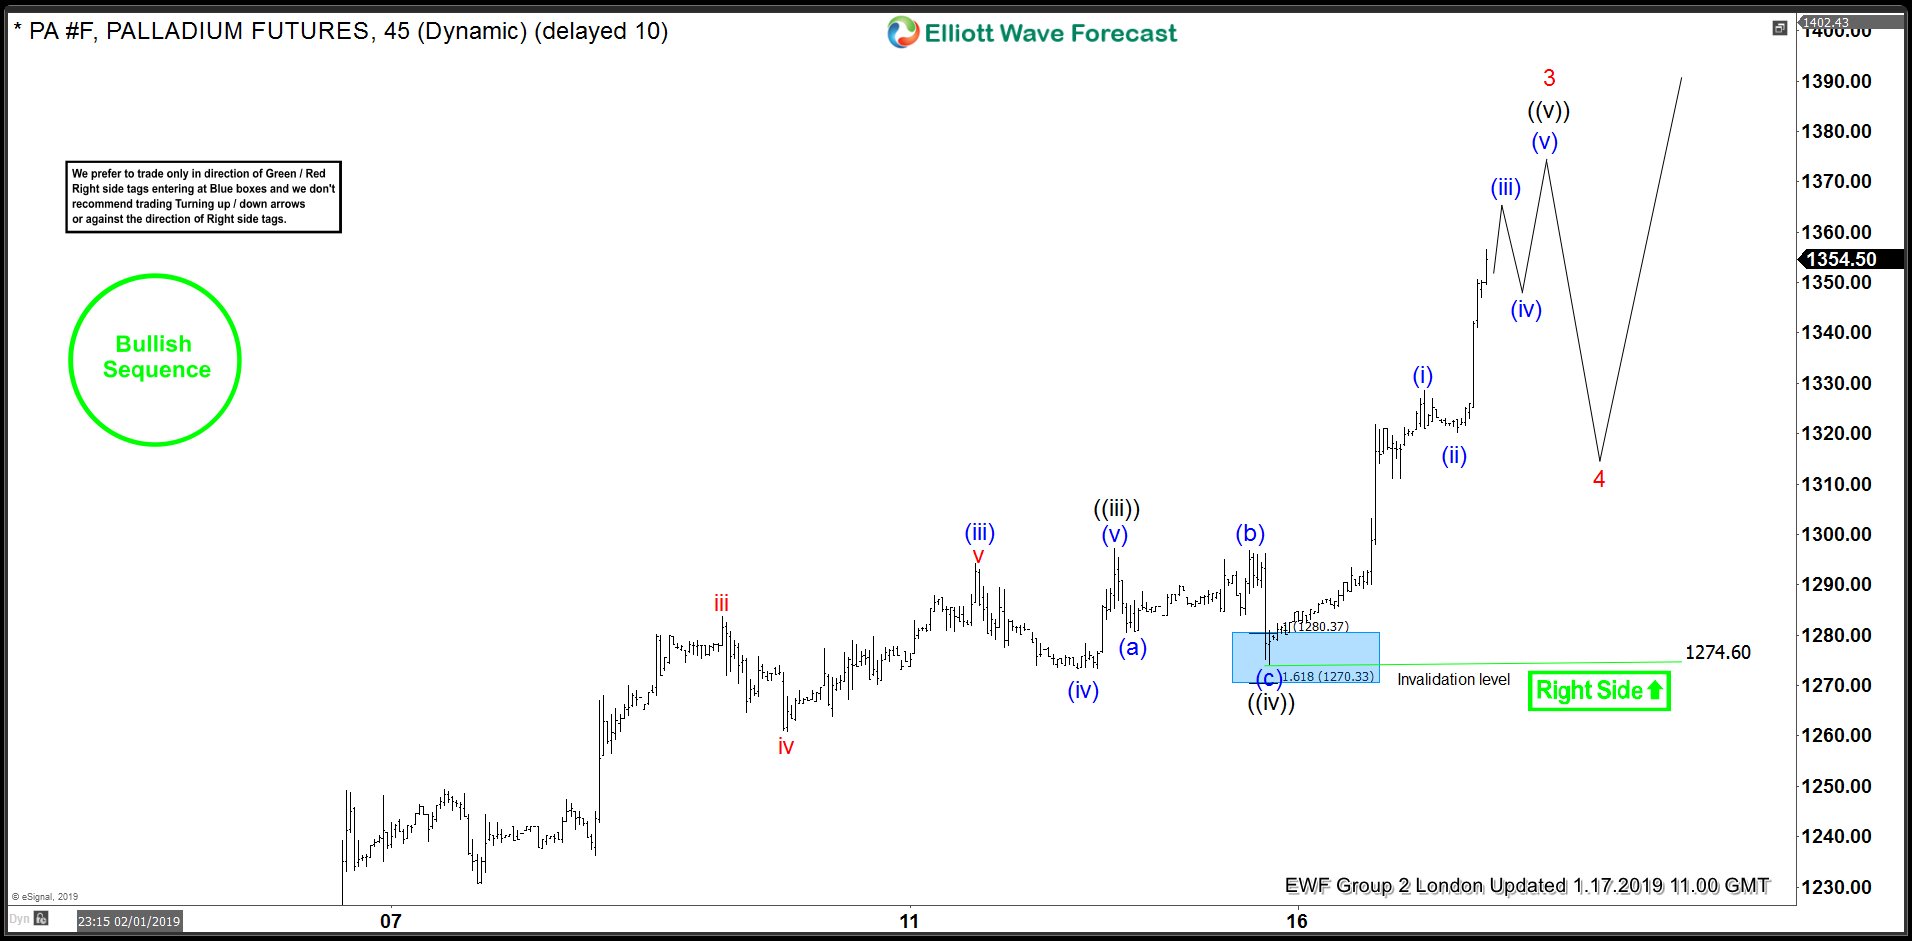
Palladium 1 Hour Elliott Wave Analysis 1.17.2019
The price has held last short term low nicely and we got further rally as expected. Count has been twicked , when now calling wave ((iv)) pull back completed at 1274.6. We can get more upside in short term before wave 4 red correction takes place.You can check most recent charts in the membership area of the site.
Note: Market is dynamic and presented view could have changed in the mean time. Best instruments to trade are those having incomplete bullish or bearish swings sequences. We put them in Sequence Report and best among them are shown in the Live Trading Room.