In this technical blog, we are going to take a look at the past performance of Palladium Futures, 1-Hour Elliott wave Charts. In which, the decline from 5/04/2020 peak is showing an incomplete to the downside with right side tag pointing lower called for more weakness. Therefore, our members knew that selling the bounces in the direction of the right side tag remained the preferred path. We will explain the Elliott wave structure & selling opportunity our members took below:
Palladium 1 Hour Elliott Wave Chart
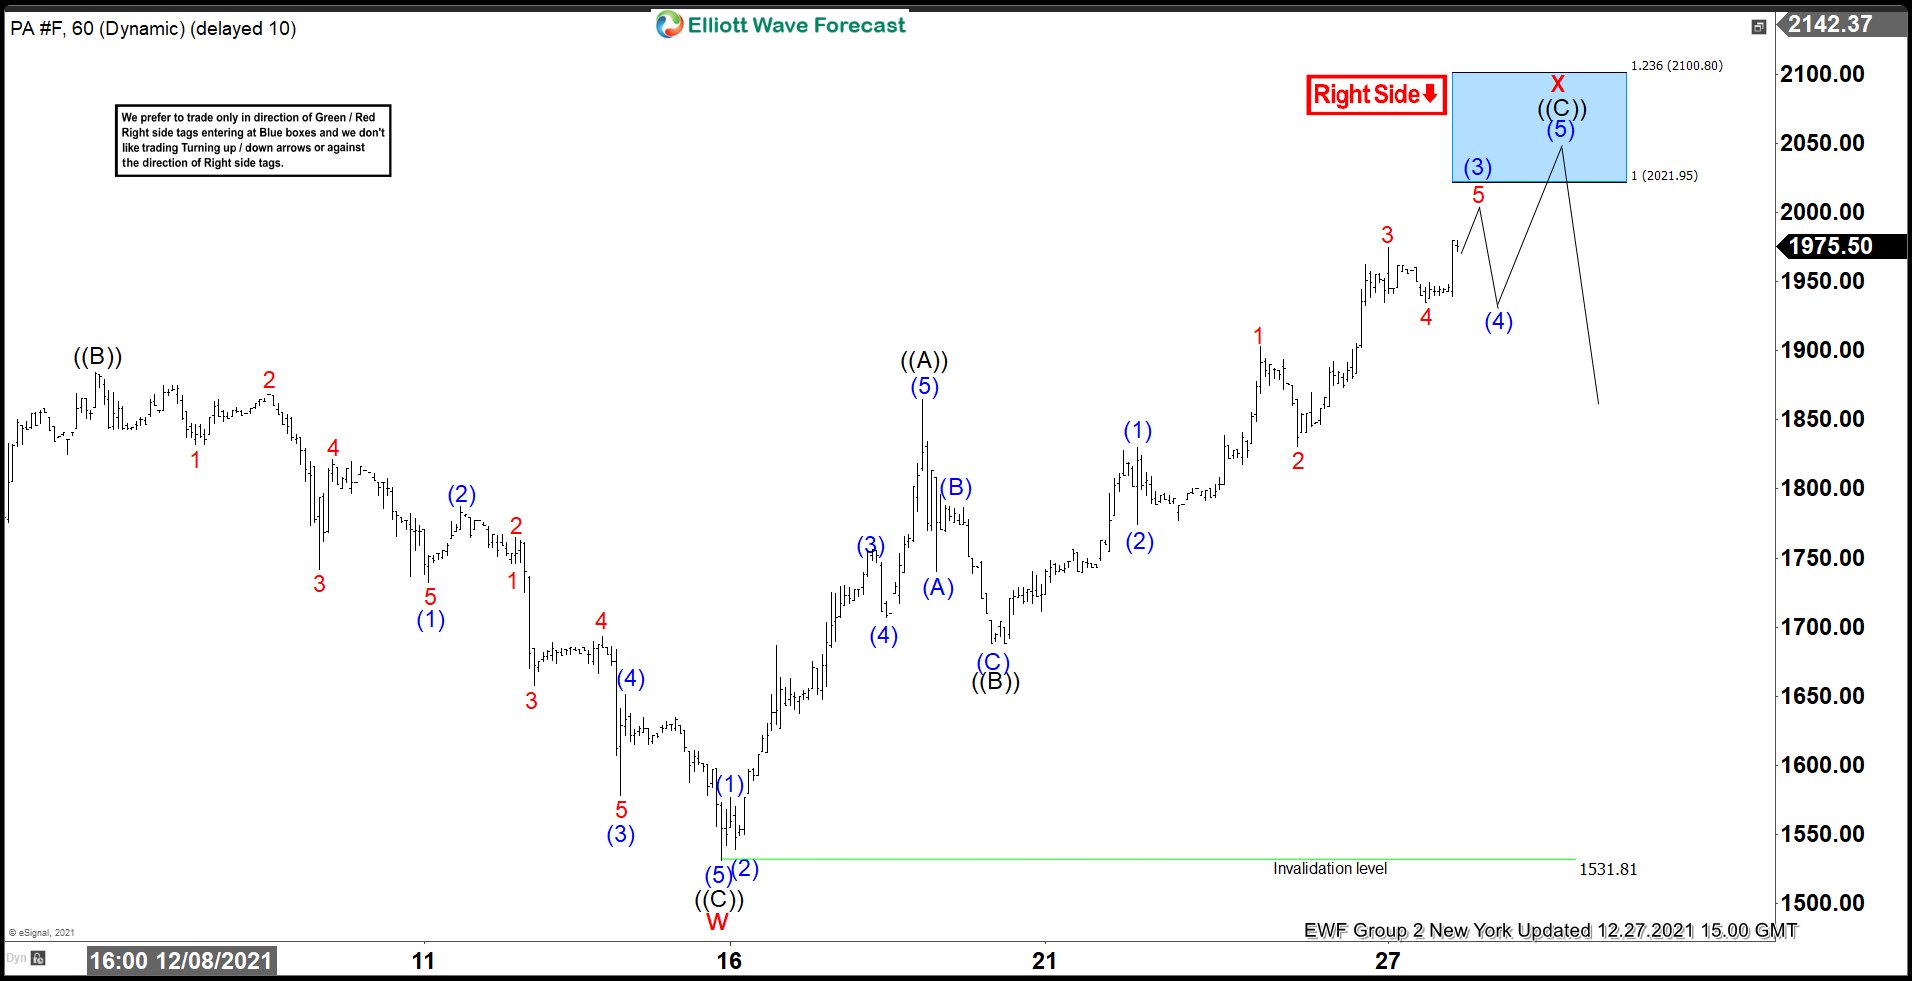
Above is the 1 Hour Elliott wave Chart of Palladium from the 12/27/2021 NY update. In which, the decline to $1531 low ended the cycle from November 2021 peak in wave w lower. Up from there the instrument bounce in wave x to correct that cycle. The internals of that bounce unfolded as Elliott wave zigzag structure where wave ((A)) ended at $1865 high. Wave ((B)) pullback ended at $1688 low. Wave (©) was expected to reach $2021.95- $2100.80 100%-123.6% Fibonacci extension area of ((A))-((B)). From there, sellers were expected to appear again looking for more downside or for a 3 wave reaction lower at least.
Palladium Latest 1 Hour Chart
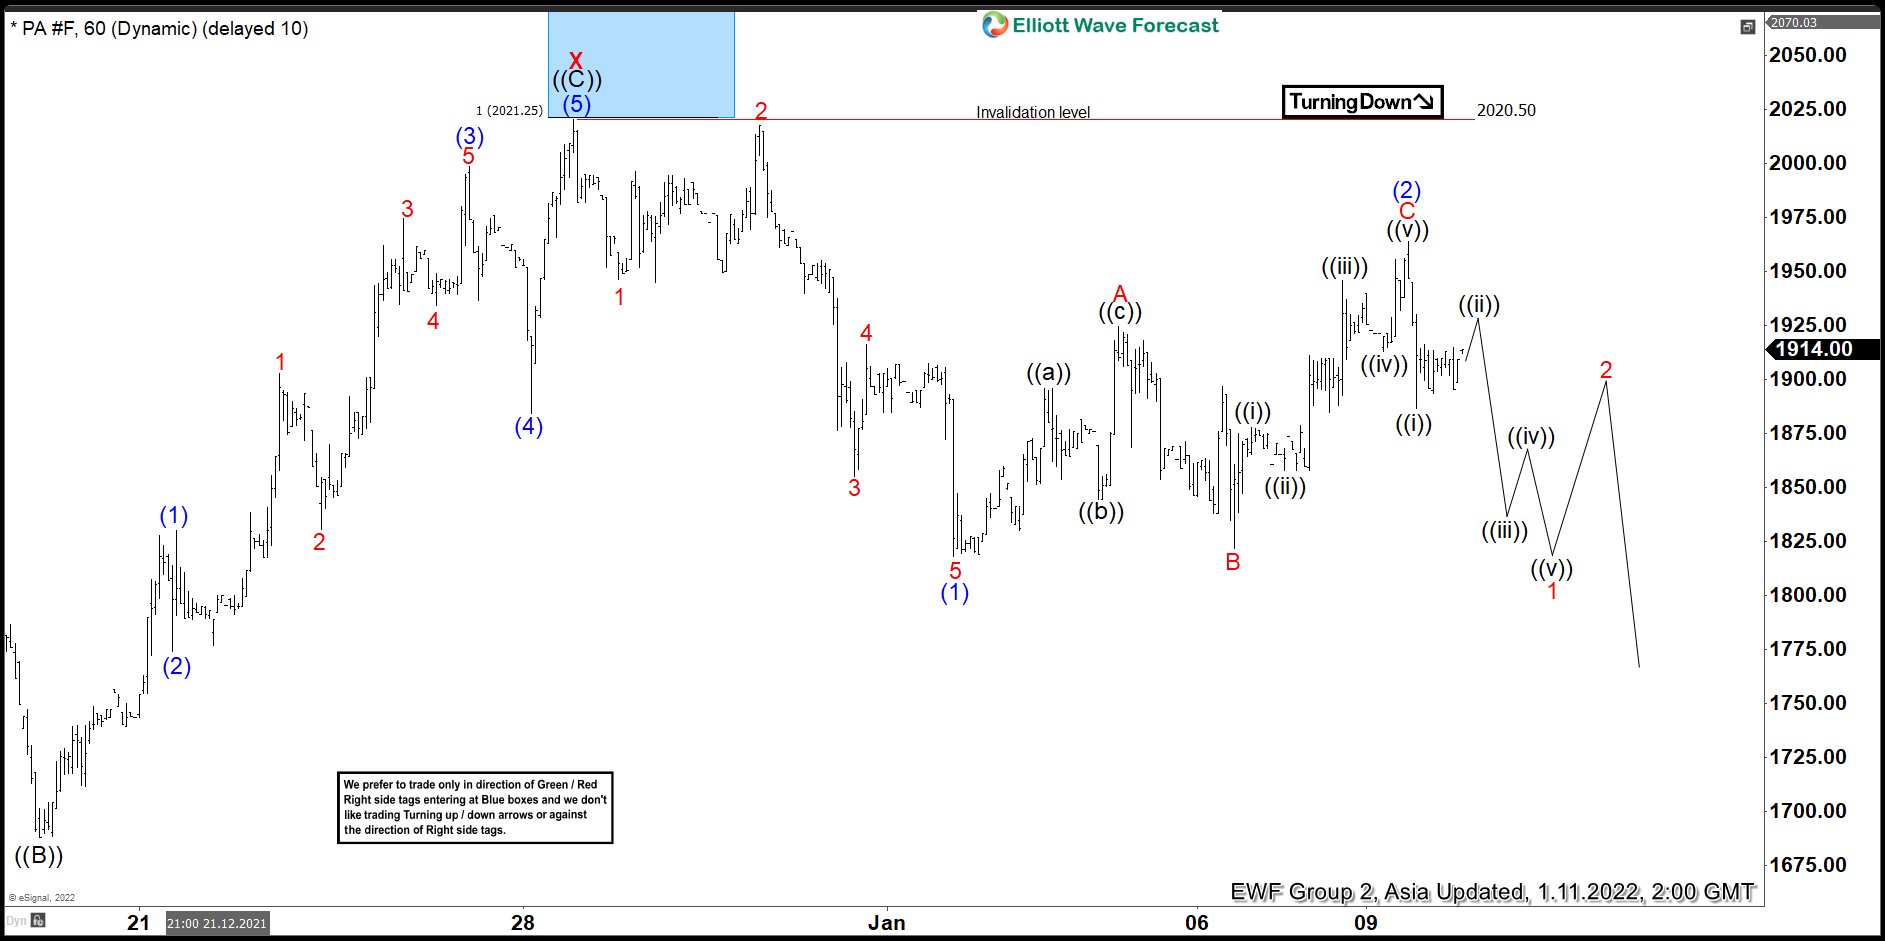
This is the latest 1 hour Elliott wave Chart from the 1/11/2022 Asia update. In which the Palladium is showing a reaction lower taking place from the blue box area. Right after ending the zigzag correction within the blue box area. Then it made a minimum reaction lower allowed members to create a risk-free position shortly after taking the selling position. However, a break below $1531 low remains to be seen to confirm the next extension lower & avoid double correction higher.