Palladium (PA_F) Buying Opportunity Ahead?

Palladium (PA_F) Buying Opportunity Ahead?

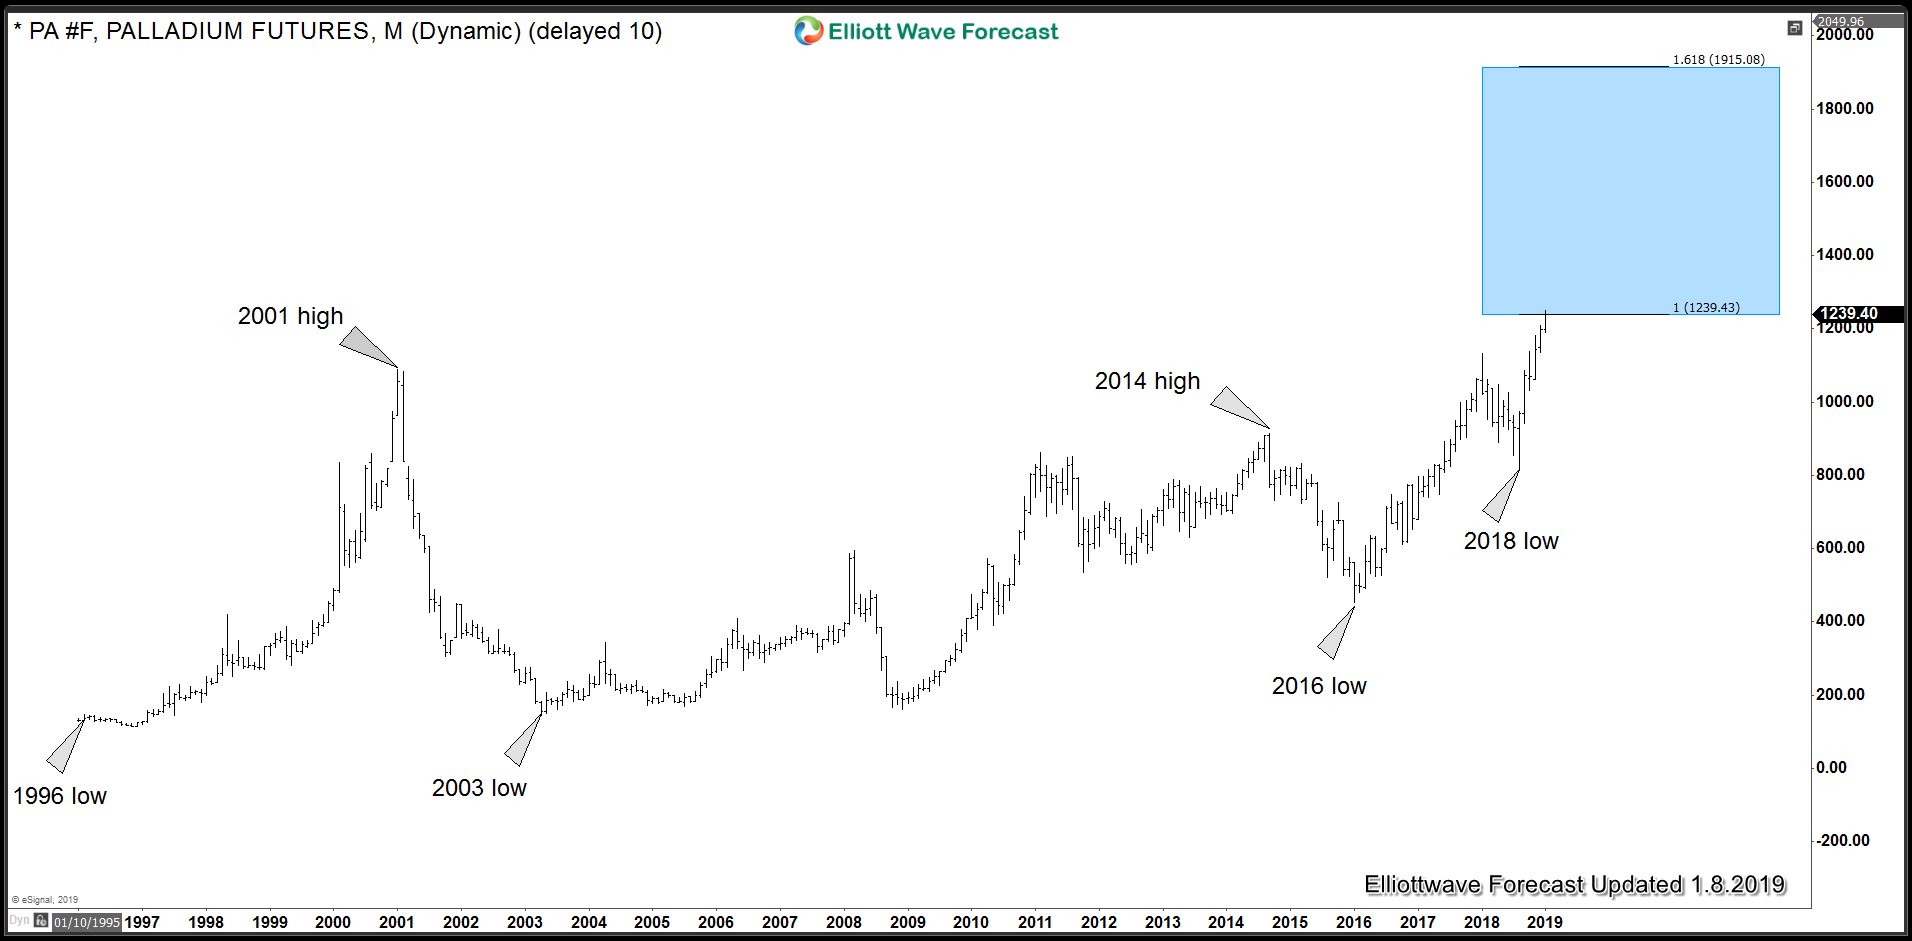
Palladium ended a cycle from January 2016 low (452.63) and the pull back should be a Palladium Buying Opportunity. Rally from January 2016 low can be counted as an Elliott Wave Impulse when rally to 776 completed wave ((1)), dip to 652.15 low completed wave ((2)), rally to 1023.95)completed wave ((3)), dip to 973.60 low complete wave ((4)) and rally to 1133 completed wave ((5)) which we have labelled as wave “a” of (III) of a diagonal higher.

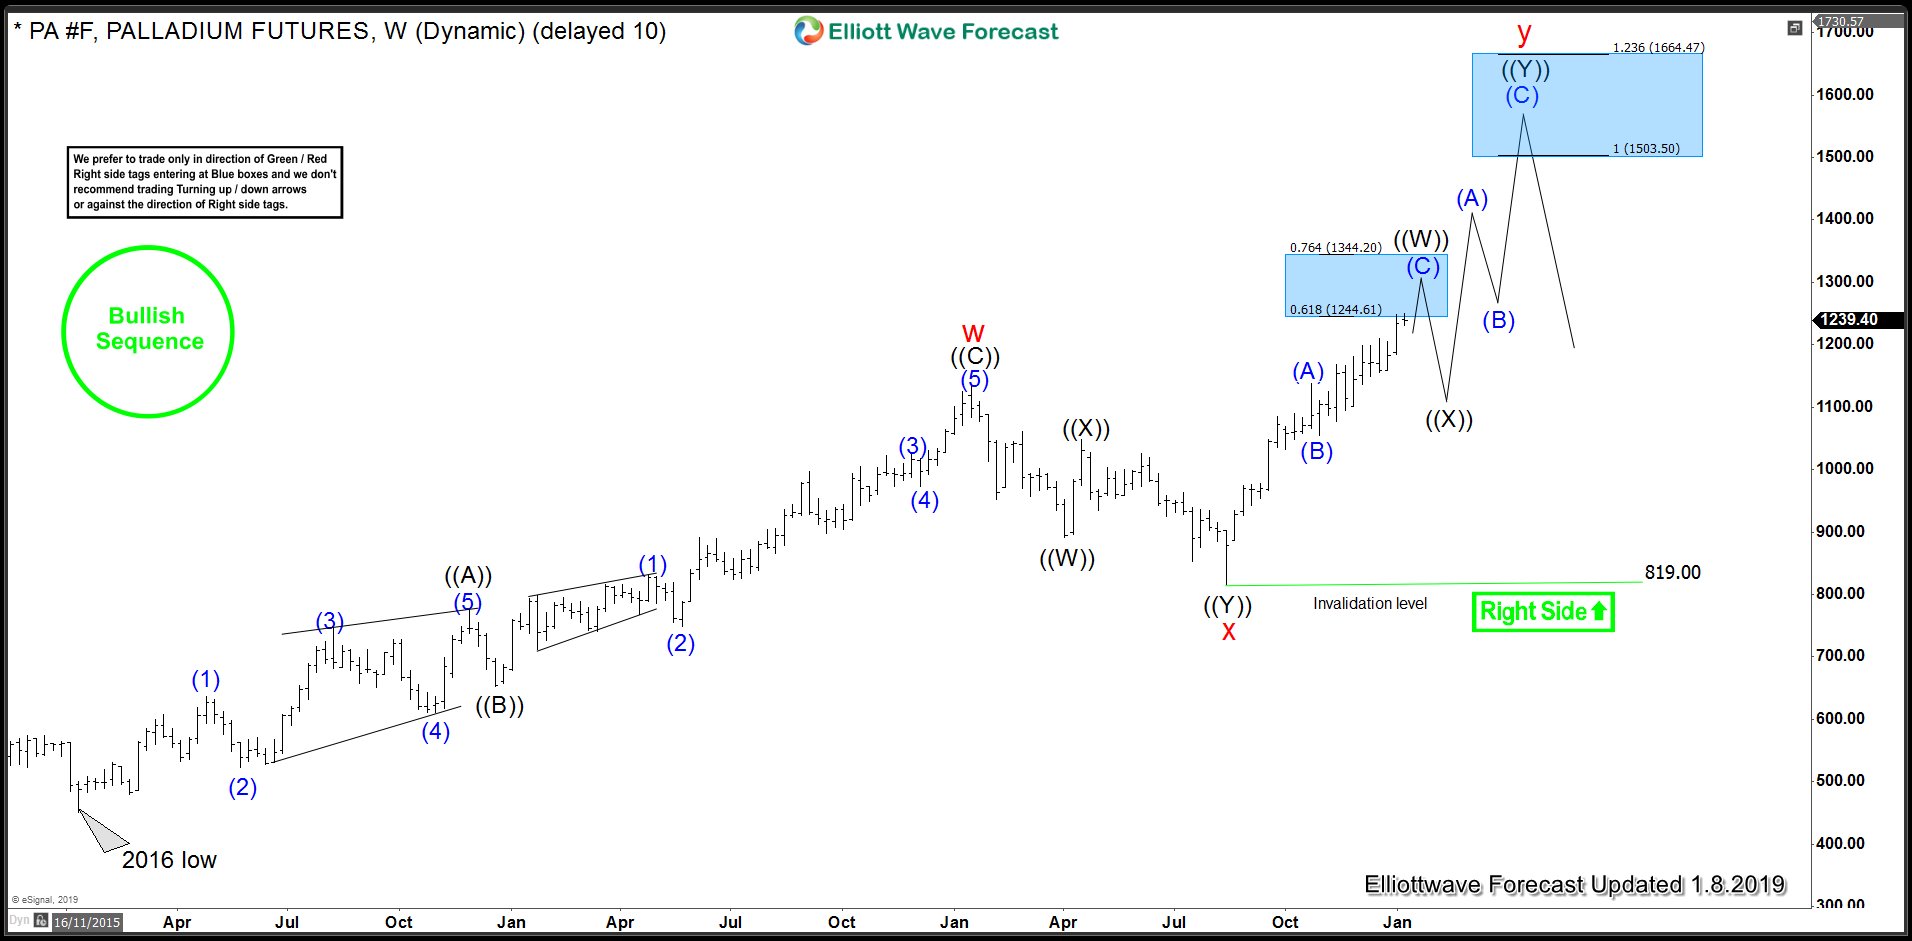
Palladium Buying Opportunity – Weekly Elliott Wave Analysis

Chart above shows the Impulse rally up from 452.63 low which has completed and we are now in a pull back to correct the cycle from 452.63 low. So far we have seen 3 swings lower to 890.85 which was followed by a bounce which has so far failed below 1133 peak. As bounces fail below 1047.75 ((X)) high and more importantly below 1133 peak, Palladium has scope to trade lower into 806.98 – 749.94 area to complete a 7 swings corrective decline. Due to 5 waves rally from 452.63 low, we expect to see buyers appearing in 806.98 – 749.94 area and then the rally can resume for new highs above 1133 peak or we should get a larger 3 waves bounce at least. Once ((W)) low at 890.85 is broken, we will have 5 swings incomplete sequence down from 1133 peak and then wave (X) bounce could offer a selling opportunity for a move lower into 806.98 – 749.94 area which is where we believe we should get another Palladium buying opportunity.

In this blog, I want to share some short-term Elliott Wave charts of Palladium which we presented to our members in the past. Below, you see the 1-hour updated chart presented to our clients on the 11/30/18 indicating that Amazon ended the cycle from 11/23 low (1094.70) in black wave ((a)) at 11/30 peak (1198.1).

As Palladium ended the cycle from 11/23 low in black wave ((a)). It started a pullback lower in black wave ((b)). The pullback proposed to unfolded as an Elliott Wave Zig Zag correction. Due to the right side bullish stamp, which you can see in the chart below. We advised members that we like buying Palladium at the equal legs from 11/30 peak. Therefore, we expected buyers to appear in the dips in the sequences of 3, 7 or 11 swings. At the 100 - 1.236 Fibonacci extension of blue (a)-(b). Which came at around 1148.62-1142.76 area. The commodity reached that blue box in the chart below and we opened a long position in that area. As that was the first area for buyers to appear to take prices to new highs above wave 1 peak or a larger 3 waves bounce at least.

Palladium 11.30.2018 1 Hour Chart Elliott Wave Analysis

In the last Elliott Wave chart, you can see that Palladium bounced nicely higher from the equal legs area (blue box). Our members bought the equal legs from 1148.6+ areas and any trade from that area are risk-free which means the stop should be at breakeven, targeting higher levels. Do please keep in mind that the 1-hour chart which I presented may have already changed.

Palladium 12.04.2018 1 Hour Chart Elliott Wave Analysis

Below, you can see the 1-hour updated chart posted on the 12/07/18 with our Elliot count perspective at the time. We expected prices to extend higher due to the 11/16 high broken on 11/29, hence our bullish sequence stamp. Under our method, we encourage our members to trade with the right side of the market after a 3,7, or 11 swing dip. Usually, said dip, corrects the latest completed bullish cycle. With this in mind, after a FLAT correction (a 3 swing dip) of the cycle from 11/23 to wave ((a)), we expected a bullish reaction. As long as the invalidation level (1094.54) was kept intact, and the dip reached anywhere within the 1-1.618 Fibonacci extension area of blue (a) & (b), we expected buyers for further upside.

Palladium 12.07.2018 1 Hour Chart Elliott Wave Analysis

Notice what happens when the metal reaches the expected reaction area of (1150-1120). Palladium makes a great bounce and starts extending higher. A 5 wave impulse wave move towards new highs as long as the 1094.71 pivot holds.

Palladium 12.13.2018 1 Hour Chart Elliott Wave Analysis

*Note : Keep in mind the market is dynamic and the presented view might have changed after the post was published.

Welcome traders, today we will look at a couple of Palladium futures (PA #F) charts. The metal reached one of our blue target areas and react perfectly to our expectations. This will show you how profitable and efficient it can be to trade with our philosophy and basic Elliott Wave analysis.

First of all, we start with Palladium futures’ 45 minute chart from December 23rd presented to our members. At the time, we maintained a bullish perspective due to our Elliott Wave analysis. Our count suggested an ending diagonal cycle waiting for a final 5th wave up. Also, a bullish sequence stamp was presented on a larger time frame. This was due to the October 23rd high broken on November 15th. Consequently, this increasingly enforced ‘the right side’ of the market; hence opening higher probabilities of reaching newer highs.

With our aggressive approach, our members are encouraged to act on our target areas with the right side of the market. Furthermore, our approach unquestionably takes a trading opportunity when a bullish/bearish stamp is also present. Although we had no stamp in 45 minute time frame, but we do have a bullish sequence stamp in the 4 hour to back up the upside trend.

Palladium 12.23.2018 1 Hour Chart Elliott Wave Analysis

Below you can see an updated chart of the instrument from December 28th. Notice how the metal reacted off of the blue box target area and resumed the upside. The area of 1160.74-1140.13 was calculated using the the Fibonacci extension tool, in this particular case, off of wave ((w)) & ((x)). This is what we call the ‘equal leg area’ where we sell or buy depending on the market.

A mapped entry, an invalidation level set up, the right side, sequences, add up to great trading opportunities. Above all, waiting for the right signals proved to be successful and we got the proposed reaction as expected.

Palladium 12.28.2018 1 Hour Chart Elliott Wave Analysis

*Note : Keep in mind the market is dynamic and the presented view might have changed after the post was published.

Trading success is a journey and you will never be perfect at it, but you can always master your reaction to the market.

Palladium reached a high of $1249.40 today, it is already up 53% since August 2018 but has now reached 100% Fibonacci extension from the all time low. It has also reached 100% Fibonacci extension up from 2003 low which means we have now entered the area where cycle from 2003 and all time low can end. However, it’s a big area and runs from $1239.49 - $1915.08 but still buyers need to be cautious of profit taking in the blue box which can produce a pull back, therefore, chasing longs at current level is risky.

Palladium Cycle from 1996 and 2003 low

PA_F Elliott Wave Analysis since 2016 low

Elliott Wave Analysis suggests, rally from 2016 low to 2018 high unfolded as an Elliott wave zig-zag structure which is a 5-3-5 structure and completed wave “w”. This was followed by a pull back which took the form of a double three Elliott wave structure and ended at $819. Back in June 2018, we highlighted this pull back as a buying opportunity in Palladium , pull back did find buyers as expected and we have already seen a new high above January 2018 peak and now we are at 0.618 - 0.764 Fibonacci extension area of red “w” and “x” cycles. This is the area where typically 1st leg of “y” leg ends in a double three Elliott wave structure. Area between $1244 - $1344.20 is expected to end the cycle from August 2018 low, produce a pull back in Palladium and then result in more upside toward $1503 - $1664 area to 7 swings Elliott wave sequence from 2016 low. As we are already at 100% Fibonacci extension from 1996 and 2003 lows, it’s risky chasing longs in the short-term and our strategy would be to wait for wave (( X )) pull back to take place. After wave (( X )) pull back has materialised, we expect buyers to appear again and take prices higher toward $1503 - $1664 area.