Pan American Silver Corporation (ticker: PAAS) is engaged in the production and sale of silver, gold, zinc, lead and copper. It also has other related activities, including exploration, extraction, processing, refining and reclamation. The company operates 10 mining sites, including La Colorada, Dolores, Huaron, Morococha, San Vicente, Manantial Espejo, Shahuindo, La Arena, Timmins and Escobal. In the charts below, we look at the technical outlook of the company.
PAAS Monthly Elliott Wave Chart
The monthly chart of PAAS above shows the rally from January 2016 low is in progress as a nesting 5 waves impulse. Up from January 2016 low, wave (I) ended at 21.59 and pullback in wave (II) ended at 10.26. The stock then extends higher in wave (III) which subdivides in another 5 waves in lesser degree. Up from wave (II), wave I ended at 40.11 and dips in wave II ended at 20.73. Expect the stock to continue higher in the months to come in wave III of (III).
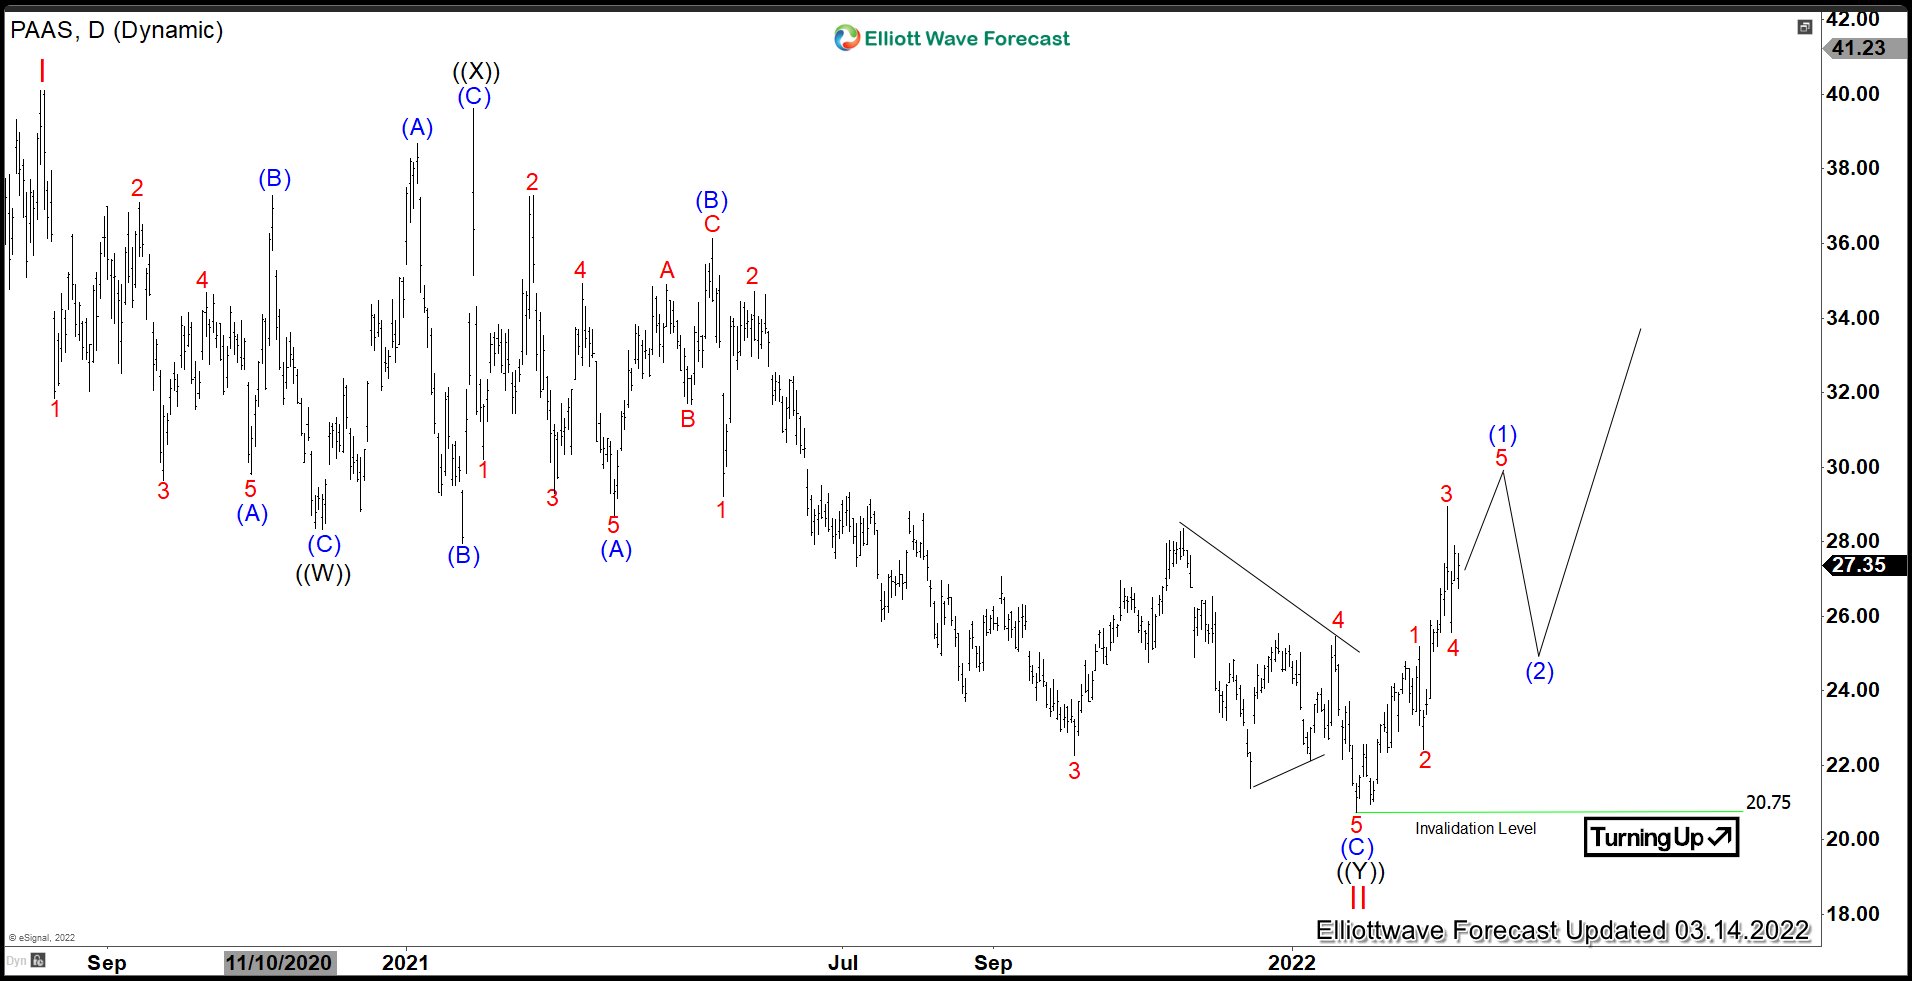
PAAS Daily Elliott Wave Chart
Daily Elliott Wave chart above shows the stock ended correction to cycle from May 2019 low in wave II pullback at 20.75. Structure of wave II unfolded in a double three Elliott Wave structure where wave ((W)) ended at 28.33, rally in wave ((X)) ended at 39.62, and wave ((Y)) of II completed at 20.75. While pullback stays above wave II low, expect the stock to extend higher.
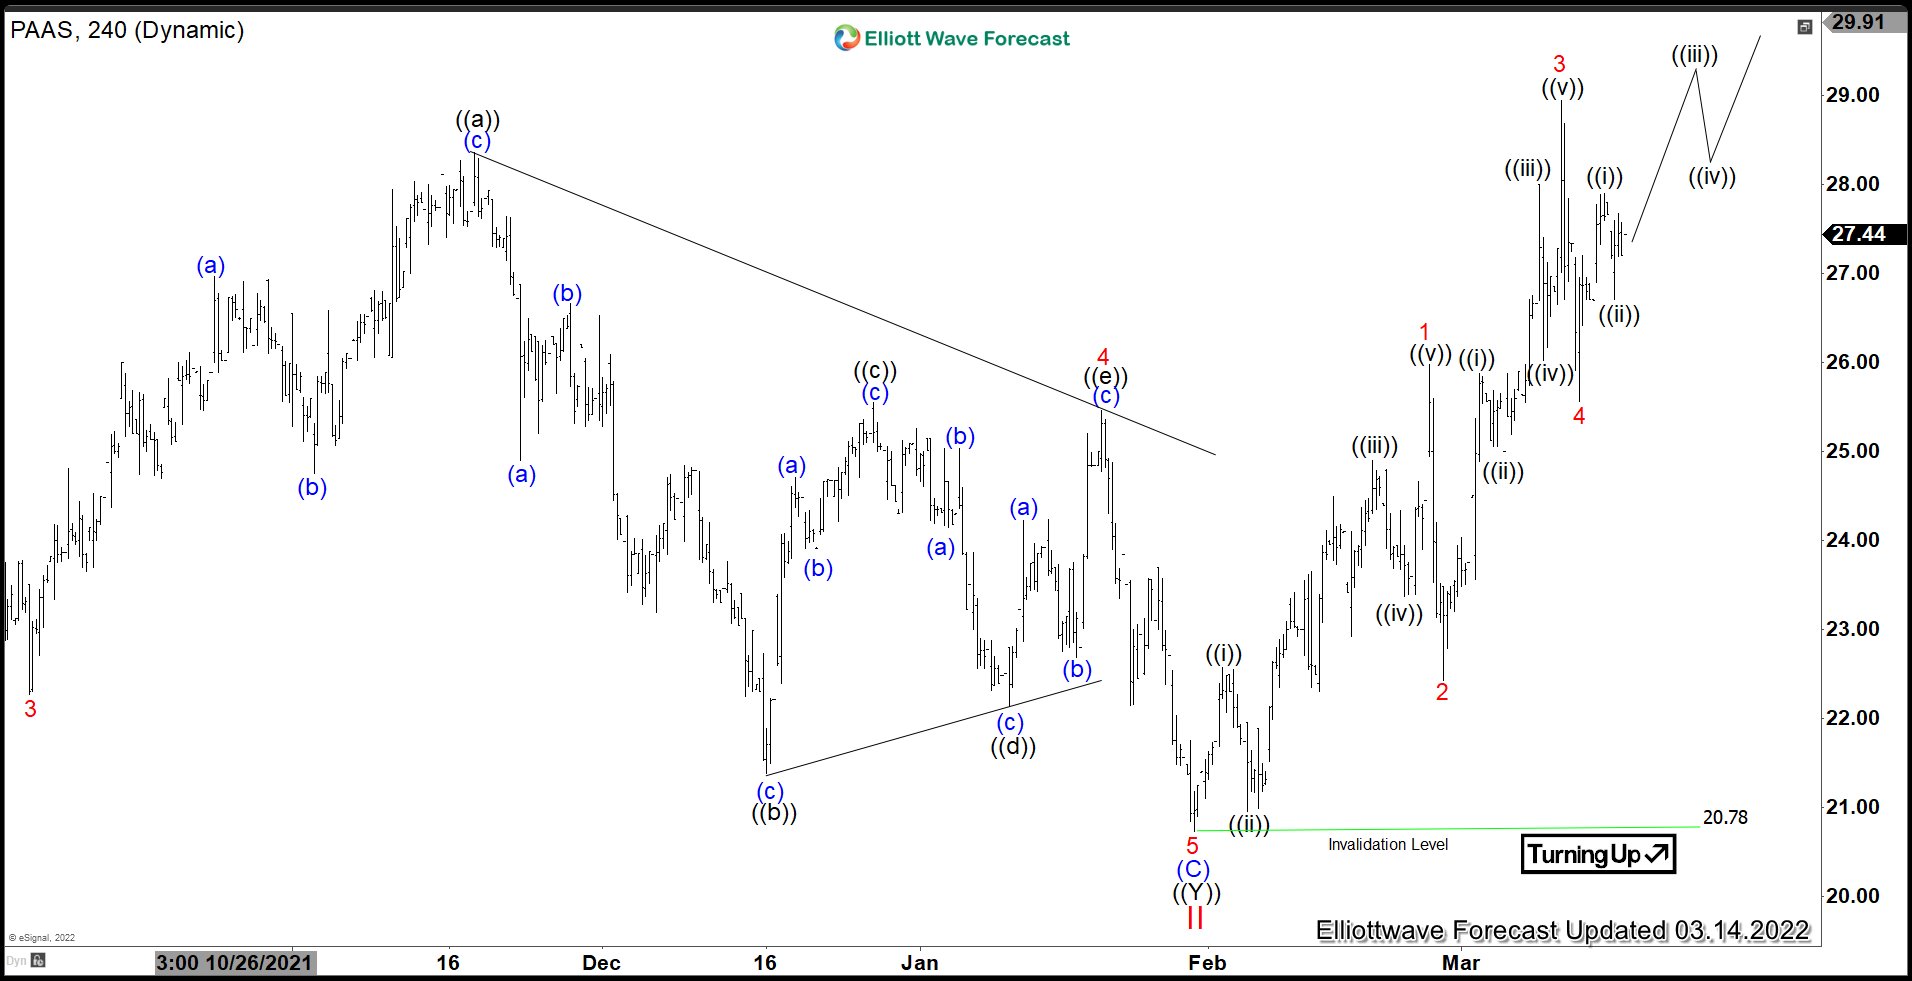
PAAS 4 Hour Elliott Wave Chart
The 4 hour chart of PAAS above shows the rally from January 29, 2022 low is in progress as a 5 waves impulse Elliott Wave structure. Up from wave II, wave 1 ended at 25.98 and pullback in wave 2 ended at 22.43. Stock then extends higher in wave 3 towards 28.95, and pullback in wave 4 ended at 25.56. Expect the stock to extend higher to end wave 5 of (1), then it should pullback in larger degree 3 waves to correct cycle from January 29 low in wave (2) before the rally resumes.
Source: Pan American Silver (PAAS) Has Started the Next Bullish Leg


