Commodities have been pulling back after the first half year rally due to inflation and war in Ukraine. The Fed has hiked rates a few times to tame the inflation, and all types of commodities have taken a step back in the past month or two, including silver. Below is a technical update for Pan American Silver Corporation (ticker: PAAS). The company is engaged in the production and sale of silver, gold, zinc, lead and copper.
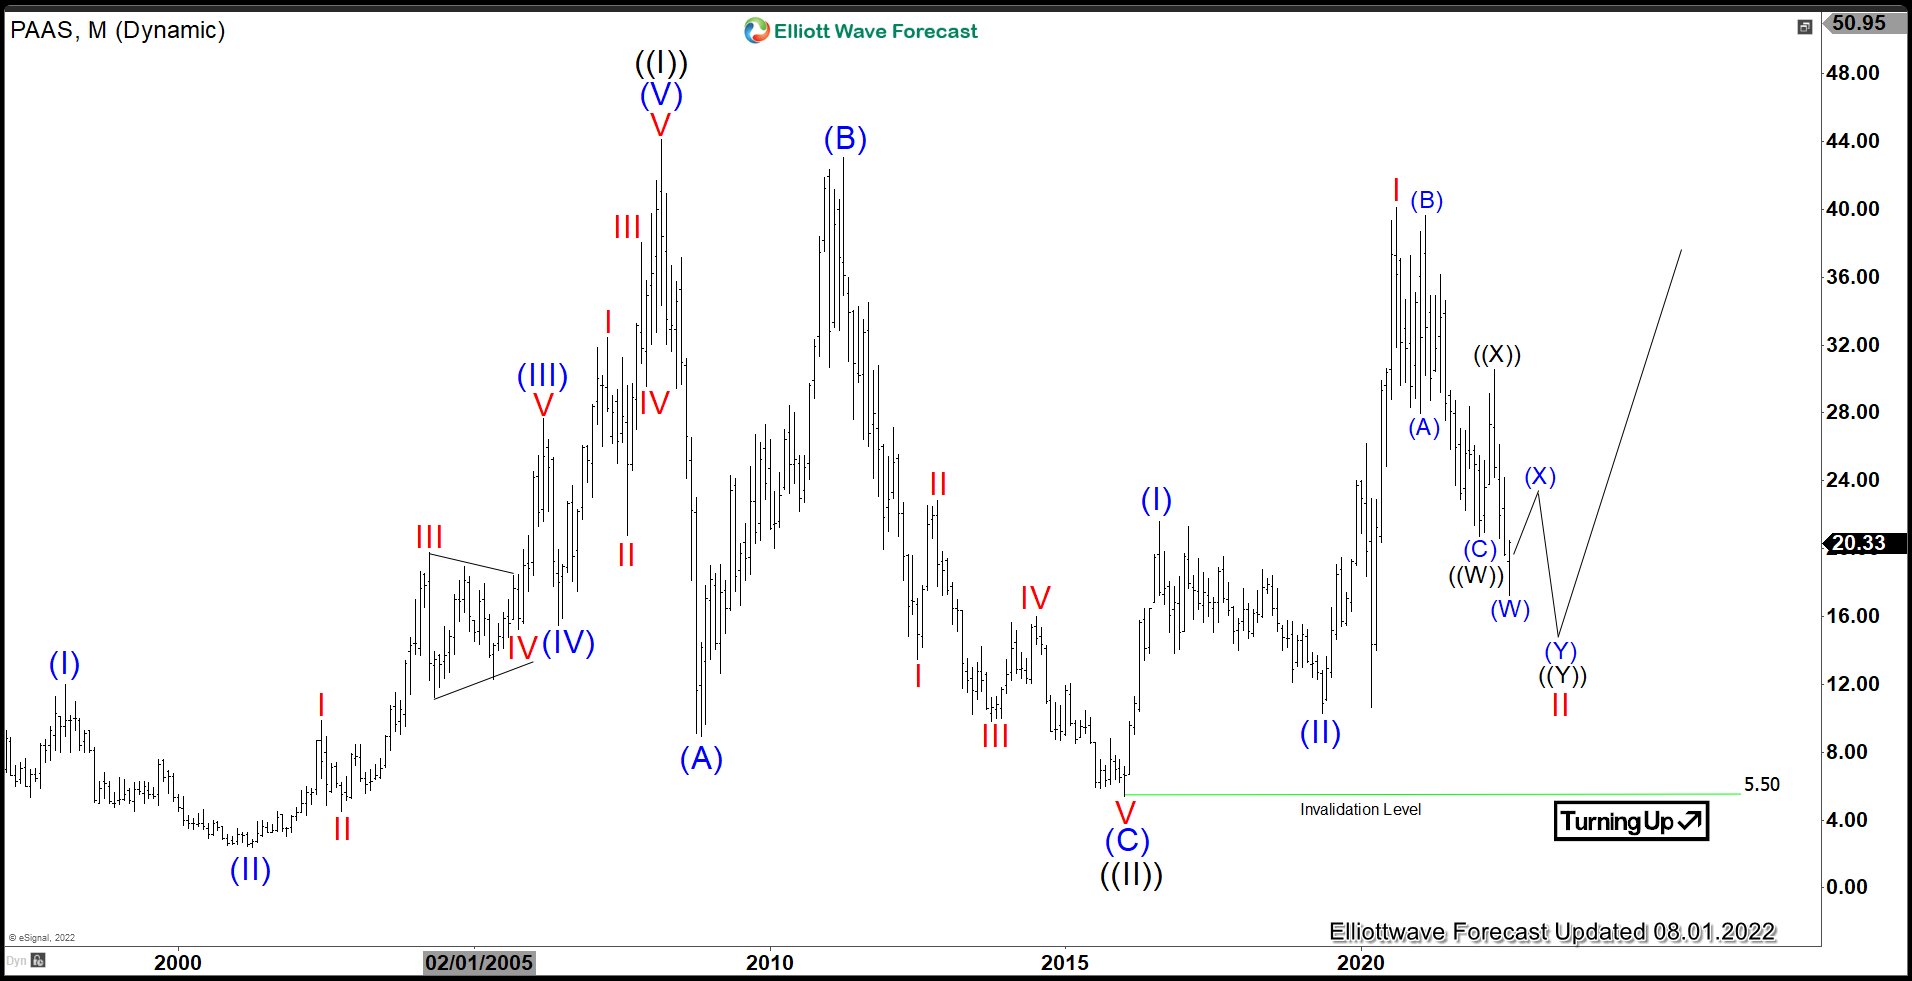
PAAS Monthly Elliott Wave Chart
Monthly chart of PAAS above shows cycle from January 2016 low takes the form of a nest. Up from January 2016 low, wave (I) ended at 21.59 and pullback in wave (II) ended at 10.26. The stock then extends higher in wave (III) which subdivides in another 5 waves in lesser degree. Up from wave (II), wave I ended at 40.11. Wave II pullback is in progress and may see further downside to complete a 7 swing ((W))-((X))-((Y)) structure. As long as it stays above $5.5 however, the stock should extend higher.
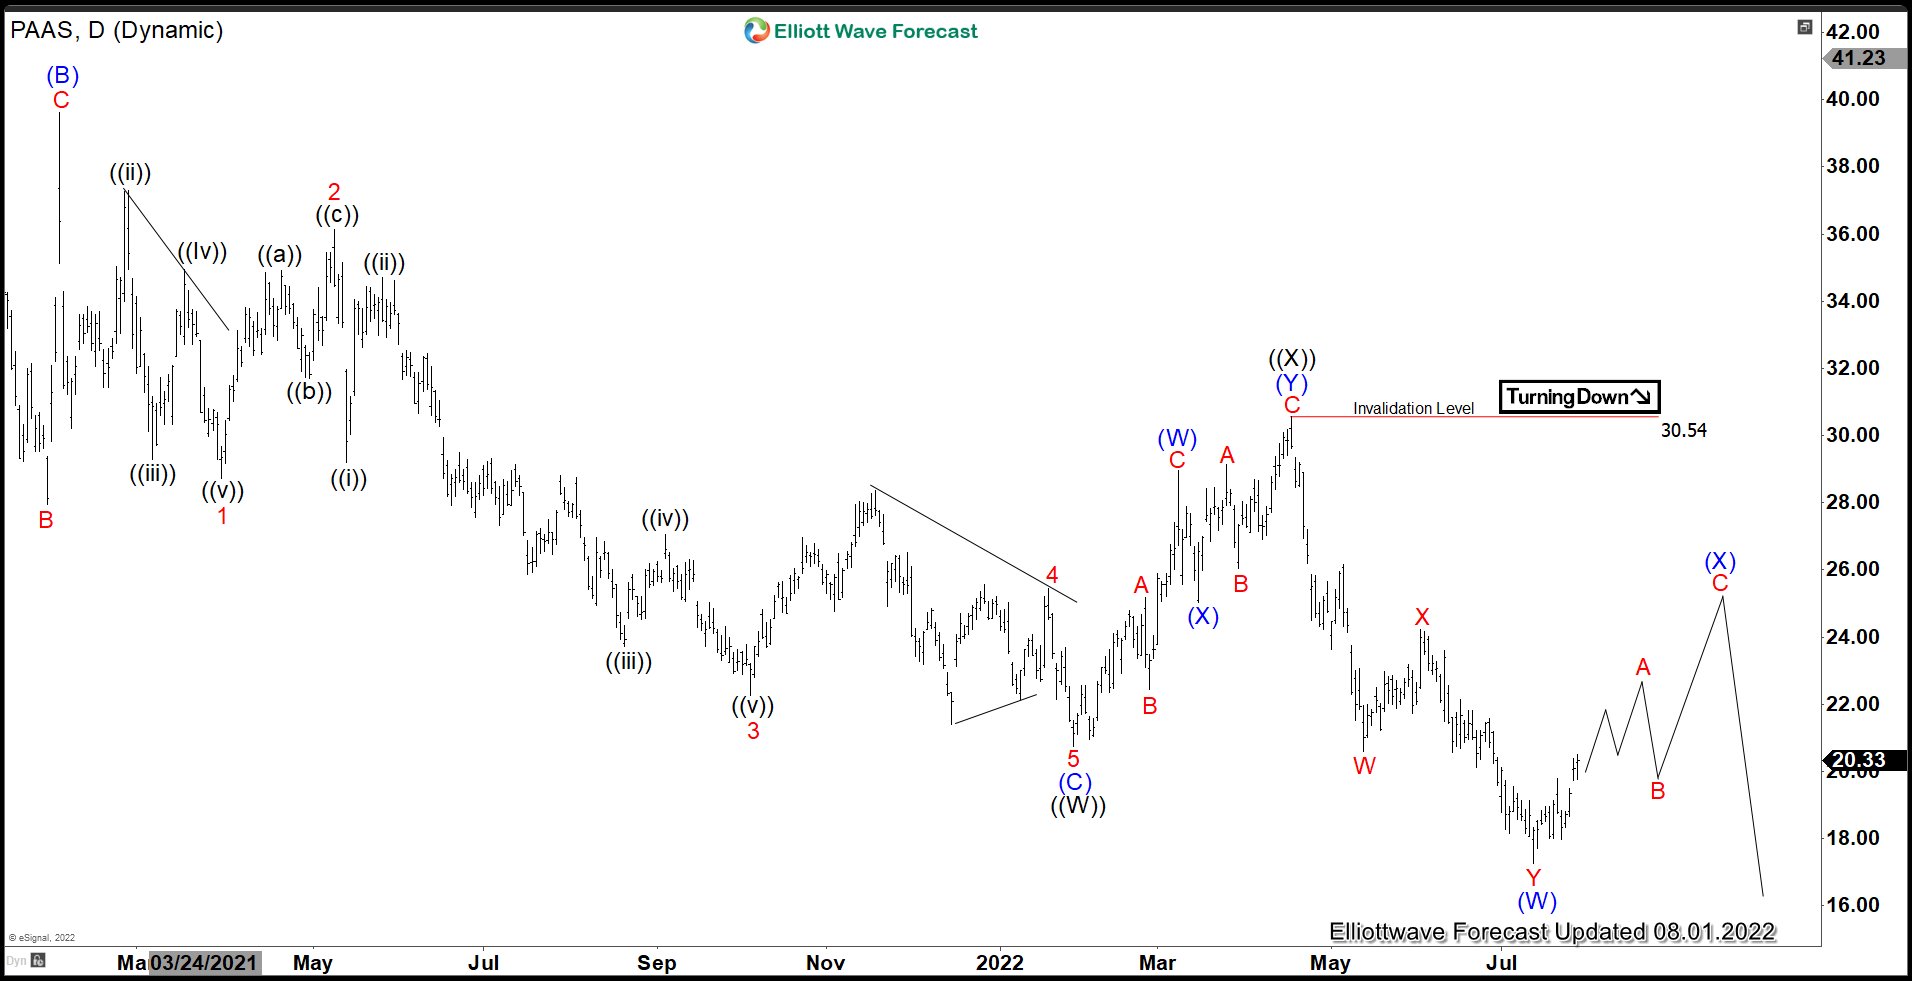
PAAS Daily Elliott Wave Chart
Daily Elliott Wave chart above shows the decline from wave I peak on August 1, 2020 high is unfolding as a double three Elliott Wave structure. Down from 8.1.2020 high, wave ((W)) ended at 20.73 and wave ((X)) rally ended at 30.54. Stock has resumed lower again in wave ((Y)). Down from wave ((X)), wave (W) ended at 17.26, and wave (X) rally is in progress to correct cycle from 4/18/2022 high in 3, 7, or 11 swing before the decline resumes.
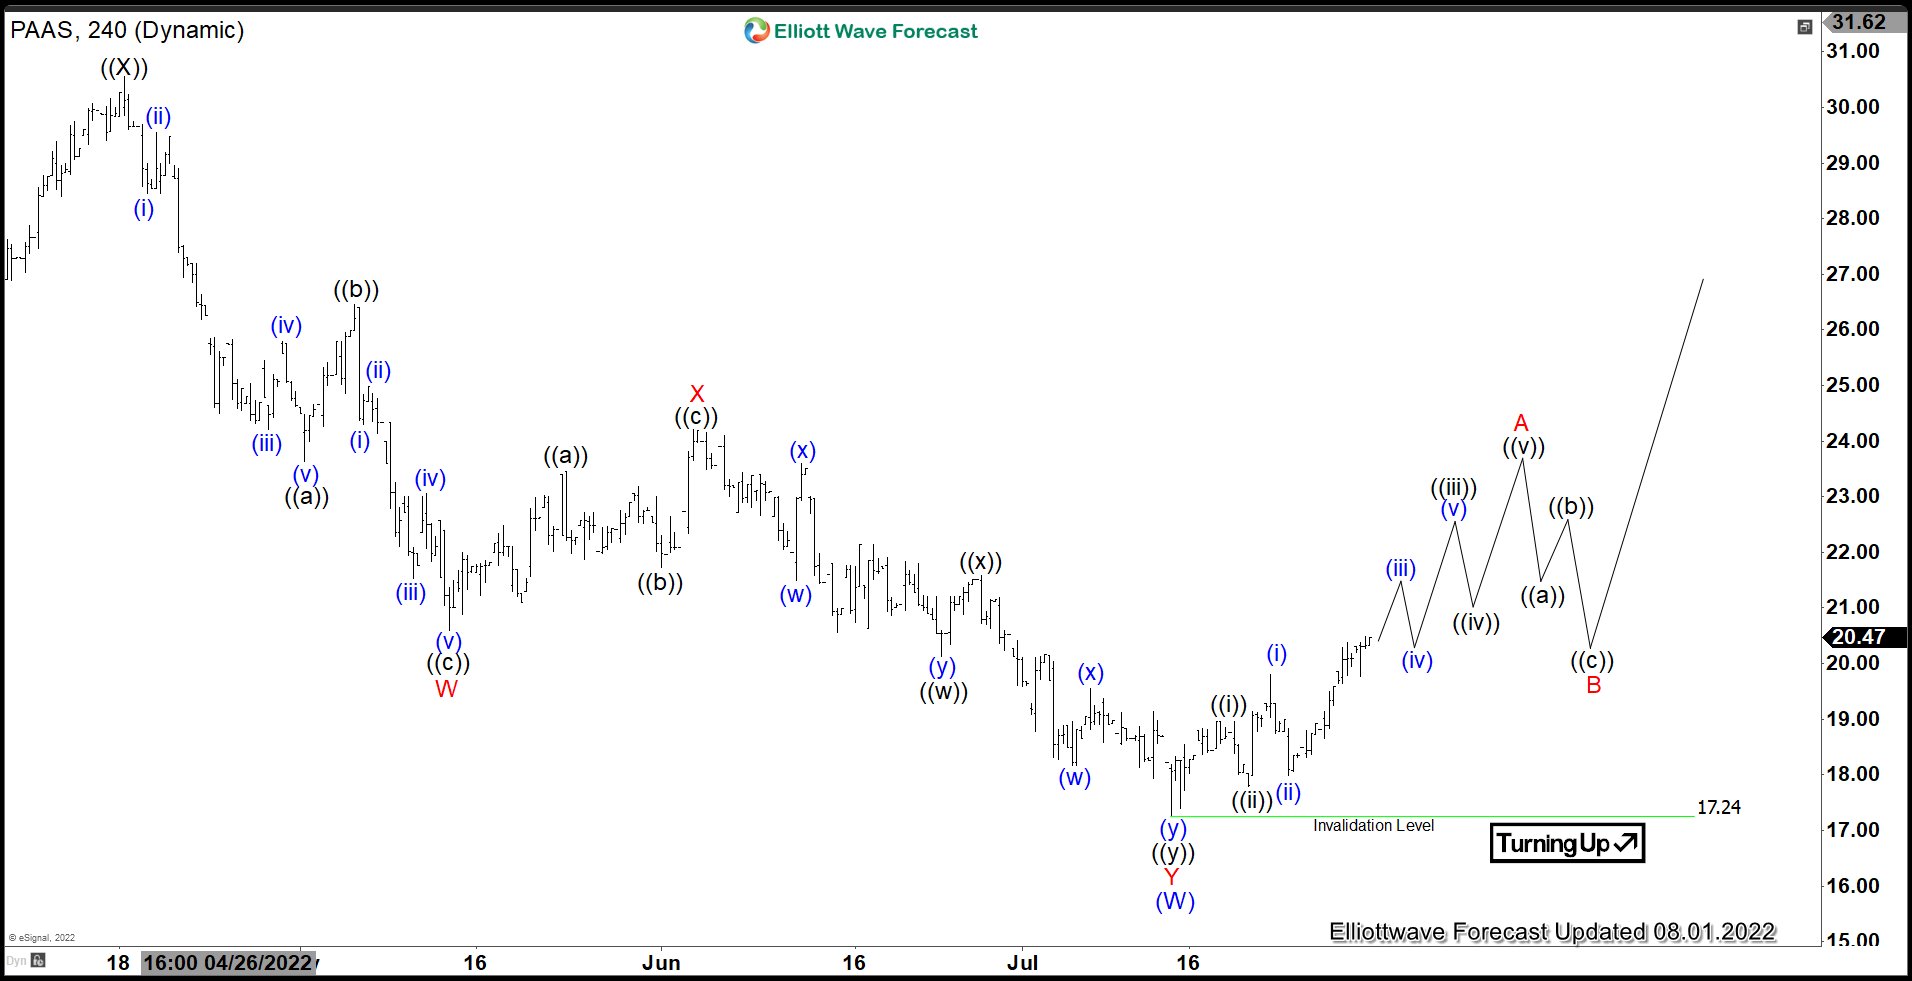
PAAS 4 Hour Elliott Wave Chart
The 4 hour chart of PAAS above shows cycle from 4/18/2022 high has ended with wave (W) at 17.24. Wave (X) rally is in progress now with internal subdivision as a zigzag Elliott Wave structure. Near term, while dips stay above 17.24, expect the stock to continue higher within wave (X). Possible target for now is 50% - 61.8% Fibonacci retracement of wave (W) which comes at 23.9 - 25.48 area before it resumes lower again.


