Hi I have been backtesting RSI, stochastics, bollinger bands, 3,5,10,20 EMA’s in isolation or combination and came to one conclusion. The only accurate and suitable indicator out there for daytrading or scalping is PARABOLIC SAR. Although considered by many to be the most inaccurate, I find it to be far more accurate than any other indicator out there! You just have to buy/sell the moment the dot appears, and hold your position until the opposite dot appears. It hardly gives of wrong signals, and the only problem with it is that it can whipsaw, but this only happens in 1 minute charts (and peersonally, I quite like whipsaws, because they help me get out of losing trades even before my SL).
You hardly see any parabolic sar whipsaws from 5 minutes onwards. My returns on demo account based on parabolic have been $2000 - $20,000 in one day from 11 trades. The accuracy is a startling 80%, compared to stochastics and others according to my journal which only has 50 or even 40% accuracy. I also noticed that parabolic SAR is rendered inaccurate if combined with another indicator, it HAS TO BE USED ALONE.
Go on and try it in a demo account. You’ll be amazed by the results! (if you make a loss, I’de be very interested to hear about it!) I only have 2 questions:
Why is it so accurate?
On what basis is parabolic SAR calculated? I can find info on all indicators except parabolic SAR.
How to succeed with paraolic SAR:
Don’t wait for the candle to finish forming. The moment the dot appears, you follow the signal and buy/sell (your profits will mostly come from this first candle)
You quit only when the opposite dot appears OR more effectively, when you get 5 pips. In my experience, 5 pips will give you a 80% trade success rate, whereas waiting may give you 4 times more pips but a lot of breakevens so you end up making less money
Use parabolic SAR only in 5 minute charts. 1 minute charts whipsaw too much. and 10 minute charts above are usually too volatile to have any trends. But on the level of the 5 minute chart, micro trends can be seen, and it is where there are trends, whether they be normal or micro or medium, where parabolic SAR shines
Now I’m not sure I want to even get involved in this discussion but I feel obliged to help save your REAL money!!!
Parabolic SAR is by NO MEANS as accurate as you think it is I assure you. There is an ENTIRE THREAD of more than +2 000 pages DEDICATED to the use of Parabolic SAR where I, and MANY others, spent MONTHS trying everything ‘known to man’ to get it to produce CONSISTENT profits and it did not and, over time, it contributed to over $80 000 is losses of REAL money!!! The thread is called ‘Parabolic SAR - that’s all!!!’
The REALLY scary thing is just how similar your post ‘sounds’ to my starting post on that thread. NOTE MY DISCLAIMER on my starting post on the thread (which was posted a year AFTER the thread was started).
Now having said ALL of that.
Turns out: none of us were using Parabolic SAR CORRECTLY and contrary to what you have read and / or (you think have) figured out for yourself you do NOT simply open a postiion when the first ‘dot’ appears and then stop and reverse when the next ‘dot’ appears in the opposite direction. THIS WILL, OVER TIME, COST YOU YOUR ACCOUNT!!! There is a lot more to it than that.
The equation (and CORRECT USE) of Parabolic SAR is found in the book ‘New Concepts In Technical Trading Systems’ by J. Welles Wilder Jnr. (who, is case you do not yet know, developed Parabolic SAR as well as a HOST of other indicators that you probably have on your trading platform WHICH, I might add, for the most part, are probably not correctly calculated by the platform EITHER so beware).
If you’re interested: there is another thread dedicated to the trading systems in the book on this site but before you get too excited: read the very first page of the thread i.e. the systems themselves are NOT detailed on the thread and never will be due to copyright restrictions
As I said: sorry to ‘burst your bubble’ but ‘all is NOT what it seems’!!!
I love PSAR…but I don’t use it by itself. I’ve actually done a bunch of manual back testing of PSAR and unless you have lots of capital you’ll end up losing a lot of money.
That being said…I think it is a great indicator to alert you of a possible trend. I use PSAR in conjunction with 3 other indicators to confirm trend and strength. Combining all these together has given me a very profitable system so far.
I’ve demoed it for a while, but on a live account I’ve had 7 trades in a row end up profitable (only trade 4h charts). Don’t put all your eggs in one basket is the best thing I can suggest.
But stick with it and develop a good trading plan around it.
you should look right when trading not left, a majority of your focus should be on what is going on to price now, using the past only as a reminder of general direction
Hi depaterso, thanks for your words of wisdom. I am a newbie with a disposition towards charts trade, that is technical focus. I’ve been told it’s not enough, but you know; we wish for impossibilities sometimes. Honestly, maybe it’s just laziness, or desire to go for the money fast.
I have some things I have stumbled upon trying to find a mix of indicators that will make it easy for me to profit in my trades without too much analysis. I wish you’d look at at it and say if it’s any good, or what can be done better to it.
I loved the Parabolic SAR the moment I came to it at the education page at babypips. So simple, you wonder if there is no catch to it! Well, I use a lot because it’s easy, and like you’ve warned, I’ve been suspicious of it that it’s not quite what it seems.
I use Parabolic SAR + Fibonacci retracement levels + SMA (14) upon EMA (44) + MACD Histogram + Candles patterns observation
If you set this up, at every time frame they seem to confirm obvious steps to take. Of course, when the Parabolic SAR gives an instruction contrary to what the Fibo and Candles point to, I ignore it! The SMA crossing the EMA always coincides with the MACD switch-over, and most times agree with the Parabolic SAR. But, often the Fibo analysis and the candlestick readings say contrary action. At that point, it comes down to me and my gut feeling.
But, I can’t say my trades have been satisfactory. Still, I am probably to blame for that. I scalp, and I do that on the 1 minute timeframe. I am too impatient to wait for even the 5 minute! So, I am being faked out a lot. I feel the 1 minute chart puts me more in touch with what is going on. I am yet to really come to terms with the fact that the charts are historic info, yet I am to use it as if it is dynamic! Perhaps, that is my struggle, when I overcome it, I shall have become a good trader, likely to live by my trades.
But, I think you guys should look into this mix of mine and see if there is something good that can be sifted from it for the benefit of the profession.
The para sar works for me as a confirmation of a trend prior to entry. I’m 6 for 6 in my last 6 trades and 8 of ten. Para Sar is not my primary indicator but it is useful.
parabolic sar is a very good indicator but it depends how you implement it in your trading plan, trading is not easy it is only profitable for those willing and patient to learn , losing money is inevitable in trading but with good risk management and and a good trading plan there are above average returns. Lastly when trading a strategy, you can only know it is not profitable if you trade it 500 times , it is called the rule of 500. Personally that is the strategy I use and I feel very offended when you mislead other new traders without any objective facts.
I beg to differ with ya’ll who says PSAR is not a good indicator.
Maybe you use default setting or wrong settings. With good setting you can make good money with it. Just buy when the first dot appear and close/sell when the opposite dot appear.
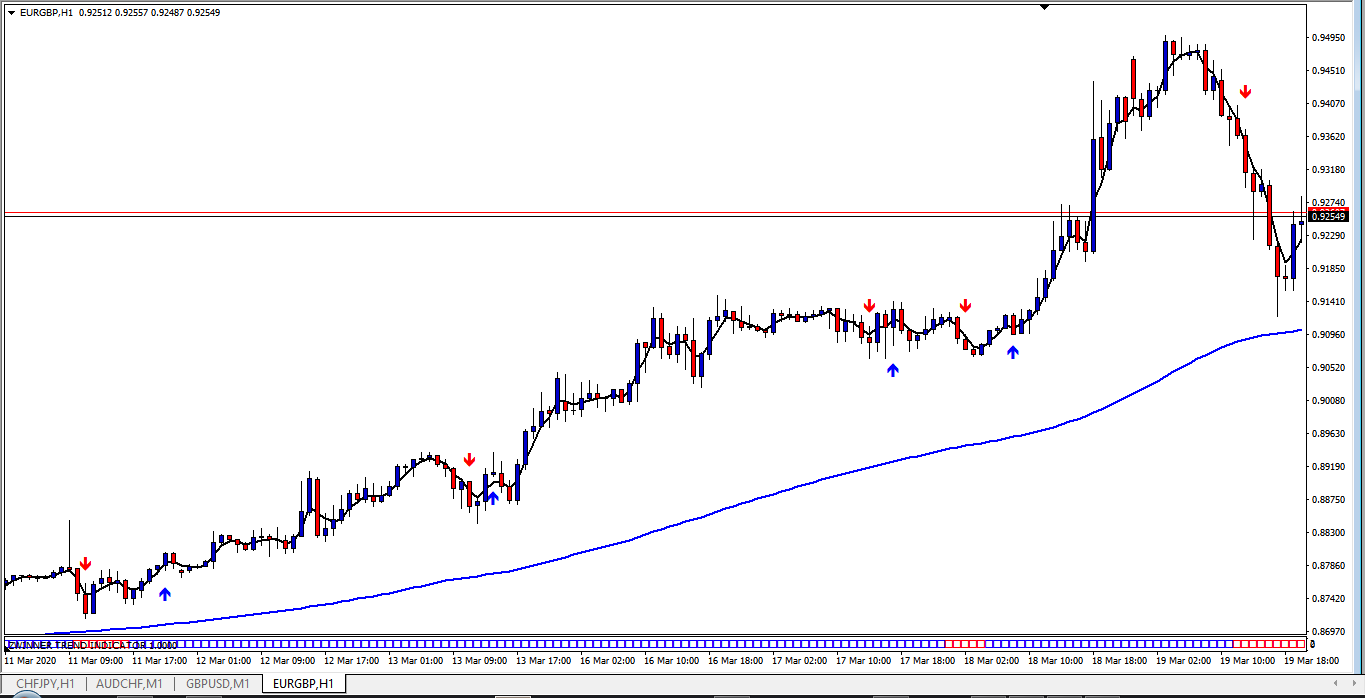
I’ve been using PSAR but I converted it to arrows to see a clear picture. I filter PSAR with Moving averages.
MA’s gives me trend direction and PSAR is for entries and exits
rklee1: I am just curious how big was your trial account results of which you mentioned in Dec '08 and how much peak leverage you used i.e. how many times equity was max open trade? (My limit of open transaction is 5 times equity) Thanks FeisalJR