Part Time trading journal

As I predicted, consistency in posting and trading has been my biggest red-flag.
Instead of complaining, let me get to the meat of this post.

A few weeks ago I successfully closed the biggest pip-wise trade in my career - I’m not sure if it’s percentage wise the biggest one, I haven’t kept detailed journals of those, but it should be right up there.

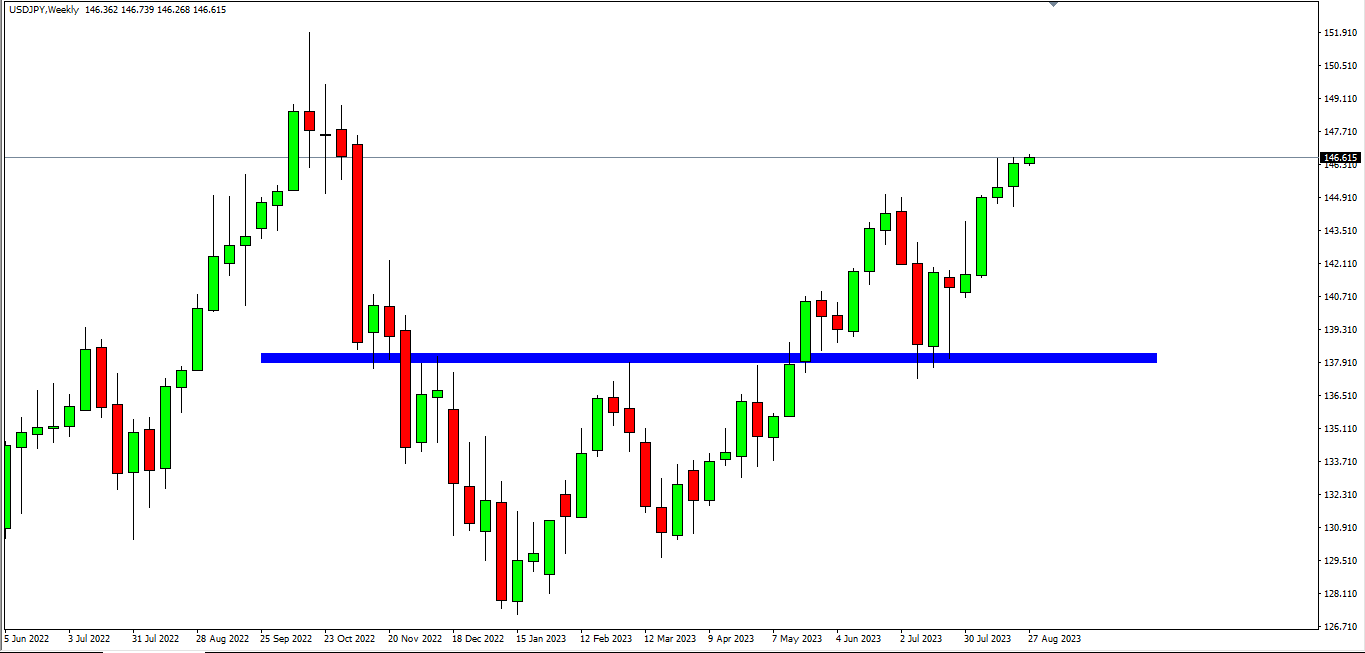
I am talking about a long on the USD/JPY, a setup that I spotted and traded on the Weekly time frame, and managed on the D and H4.

  • Price had a huge bullish run from March 2022 until October, and then it topped out at 151.939.
    Here is a zoomed in look

  • Then it went in to retracement mode and bottomed out at 127,218.

  • After the retracement I was looking for a push towards the upside for price to reach Fibonacci levels, which it did (see the image bellow)

  • At that point I as waiting for a reaction, either a breakout or a reversal, and we got a strong breakout.

  • I waited for the breakout to die down and for price to retrace to previous resistance now hopefully becoming support, which was corresponding to Fibbo levels.

  • Price not only retraced to the expected levels but also gave me a pinbar to base mu trade on (I prefer to trade on the time frame where I spot the setup, it’s much more simpler and straightforward)

  • I setup a Buy Stop Order and wait

Trading Ticket

  • Type: Buy Stop
  • At Price: 141.879
  • Stop Loss: 139.673
  • Take Profit: 147.823
  • Risk in Pips: 220

Entry explained:
The pinbar is a strong reversal singal as we all know. So I set up entry 5 pips above the high of the pinbar in order to confirm that the previous week’s high was taken out, and the stop loss was placed by measuring the entire candle dividing it by 2, and then adding 5 pips bellow that level. It’s just a trick that I learned from my mentor. The take profit was placed at approximately 80% of the range of the previous high, but as you can see I closed it before that even though it’s approaching that level.

After the position got triggered I carefully started to monitor and manage the trade on the lower time frames.

  • In the second week price finally moved significantly enough for me to make some moves, So i cashed out about 66% and moved the SL to a previous swing low on the D TF. The logic behind the TP was because it reached a previous swing high on the D, and I did not want to risk the 290+ pips I already had, so I reduced the risk by taking some money off the table and moving the SL, at that point it was basically a profitable trade regardless of the outcome.

  • Few days after that price again moved significantly, but started to show signs of weakness, and I was already happy with everything and even adjusted my SL in the green, but I did not have the mental strength to hold on any longer so I closed the final 33% at 145.914.

Total Profit in Pips: 404

I have never in my life had a 400+ pips win, and If I was patient it would have been 500+ at this point.
But trading is a marathon not a sprint.

What I learned from this trade is that I should hold on to winners longer and that higher time frames ALWAYS ALWAYS ALWAYS ALWAYS prevail over smaller time frames, and that technical analysis works…on longer time frames.

Also to be completely transparent, I am always more interested in this entire process then the profits. I just love this pip hunting game.

1 Like

Update: I’m currently part of a trading funding challenge on the lower tier just to see how I will do. When I pass that I will go for those 100k+ accounts hopefully.

In order to adapt to the new scenario I’ve made some qualitative changes to my strategies.

Instead of blindly every single opportunity the 28 pairs give me, I am only focusing on those that I can see are in an area I want to get involved in on the Monthly, Weekly, and Daily Time frames.

For example, If I spot NZD/JPY is at a major infliction point on the Monthly chart and price is making a reversal or breakout and I can not spot any candlestick pattern to base my position on, then I zoom in to the Weekly, if the same is there I go on the Daily. If I can’t spot any opportunity on those 3 main time frames, but I can clearly see on the Monthly and Weekly that there is a reversal or a breakout, then on a daily basis I start searching for price patterns on the H4, H1, by implementing 3 different day trading strategies to locate a potential entry.

Also, important to note that the preferences always is to find an entry on the Weekly and Monthly, sometimes the Daily time frame, simply because of risk reduction. On the indraday charts, big impact news events can mess up your position, and I’m trying to avoid those. So in case I do need to go in lower and search for entries there, I will also need to look at the economical calendar which gives extra complications to the entire thing.

For example I’m currently involved in a short on EUR/USD based on the Monthly chart, so I’m not looking at any pair that have the EUR or USD in them up until I secure that trade, meaning it’s risk free or break even at minimum.

EUR/USD - Short

July’s Monthly candle closed as a very clearly defined pinbar. The only issue I had was that this was nowhere near the overall trendline that has been happening on EUR/USD all the way back from 2007.

But baring in mind that horizontal levels are more powerful then diagonal levels I decided to continue developing this position.

Image 1 - click on image to enlarge

This is the classic way I look at the chart, (zoom in maximum, then minus zoom 2 times in MT4). The pink lines are monthly levels of support and resistance, and this chart is currently the monthly outlook.
As you can see we can clearly define a horizontal level, which even though broken twice, corresponds with a Fibbo level of 61.8% which was touched to the pip literally by the pinbar.

Image 2 - click on image to enlarge

A closer look at the candle formation can paint a better picture of why I decided to do this. It was a clear attack from the bulls, which was a failure, signaling that the bears are still strong in this market and not only that, they are preparing for a new attack.

Setup: I placed a sell stop order with an entry 5 pips bellow the lowest point of the pinbar and the stop loss was placed by measuring the entire length of the candle, marking the 50% point and 5 pips above the 50%. Basically, a conservative entry with an aggressive stop loss because if I went with a conservative stop loss the entry would have been almost 450 pips away from the entry point which is way to long for my taste…I mean, if price goes 450 pips the opposite direction you can close it before it gets there.

The ticket got activated on the 23 of August, almost 4 weeks after setting it up, and once the monthly candle closed there wasn’t enough room for me to do anything else except to leave it be.
I set the final target at a conservative level (at least from my perspective) which is somewhere around 70% from the full swing potential I could be exploiting for this ticket.

Management
The first issue I am seeing is when we zoom in to the Weekly time frame, we can spot a clearly defined ascending channel where price is currently approaching and testing very rapidly. I am expecting a bit of hesitation here, but from the momentum we are seeing on this pair, it should be no problem for the bears to break this barrier and continue overtaking territory.

Image 3 - click on image to enlarge

The other big support zone we need to break is the 38.2% Fibbo retracement, after we pass that there are no major issues on the chart to look out for, at that point only fundamentals can mess this up.

Details

Pair: EUR/USD
Position: Short
Type: Sell Stop
Entry: 1.08287
Stop Loss: 1.10590
Take Profit: 1.00547
Risk in pips: 231
Target in pips: 774
R:R - 1:3

Plan of Action

Being completely honest here, I don’t know If I will have the mental strength to see this through. It’s a very time consuming position with a big risk to reward ratio. It might take a few months for price to get there, I’m hoping I won’t be tempted to cash out profits early, or even to take out partial profits.
My only plan is, once price moves past the 38.2% fibbo line, to move the stop loss to break even and completely offset the risk and hopefully clear my mind enough to see this go through all the way.

p.s: as of this moment (Septembar 5th 2023 - 13:23 GMT+2) I am +98 pips in profits :crossed_fingers:

EUR/USD is still in the green, almost 350+ pips.

The third month has opened for my EUR/USD short, and the bulls are still in control.
I’ve marked the halfway point for my profit target (1.0447), that is the place where I will move my stop loss to break even, it’s very near around 40/50 pips, so I’m expecting that point to be hit this week.

Screenshot

All of the Fibbo levels have been broken, and price has exited from the ascending channel on the weekly as well.

Screenshot

I also have a strong bullish trend on the H4 showing on my trending strategy.

After I move my SL to BE, I’ll be able to search for trending opportunities on the EUR and USD more freely, now I’m extremely hestiant on overexposure.

On other news, I have 2 more open positions:

  • CAD/JPY, Long
  • EUR/GBP, Long

Both are ITM, but EUR/GBP is kind of struggling even though I’ confident in the technicalities of the setup.