$PFE Elliott Wave Cycles & Long Term Bullish Trend
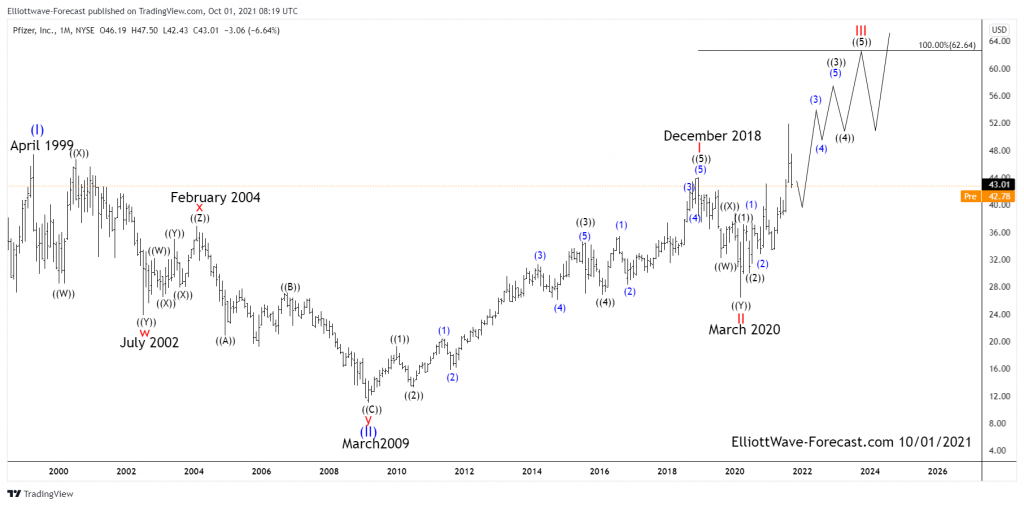
The Pfizer Long Term Bullish Trend and Elliott Wave Cycles suggest the stock price will be trending higher. The cycles project it should continue toward the April 1999 highs while it is above the March 2020 lows. From the beginning of the stock trading it had a couple decades long uptrend cycle to the April 1999 peak. This is where the analysis begins on the chart at the larger degree blue wave (I).
Firstly I will mention that is roughly a 10 year decline in the blue wave (II) to the March 2009 lows. This was certainly long enough in time and price to correct the previously mentioned decades long up trend cycle. The pullback was a basic seven swing double three correction. You can see the subdivisions of the larger degree red w and y subdivided into three swings each as well. The connector wave red x appeared to have been a triple three although it is not of any significance now. It served the purpose at the time of being the connector wave.
Secondly I will talk about the impulsive bounce from the March 2009 larger degree blue wave (II) lows. I would also like to mention you can see the guidelines for reading Elliott Wave structures at our website. From the March 2009 lows the larger degree red I subdivided into a clear five waves. There was enough room on the chart to show the subdivision the wave ((2)) lows to the wave ((3)) highs into five waves of smaller degree in blue. The analysis and conclusion continues below the chart.
PFIZER Monthly Chart $PFE
Thirdly as you can see the wave ((4)) lows in February 2016 to the December 2018 highs was also extended enough to show the subdivision of the wave ((5)) cycle. I also will mention some of the technical aspects of why the red I and II is favored in place to give that target area.
The stock clearly shows a five waves impulse from the 2009 lows. The read on the momentum indicators like rsi suggested the dip to the March 2020 lows corrected the whole cycle from the March 2009 lows.
In conclusion, ideally the stock will go higher while above the March 2020 lows. To get the longer term target area beginning at 62.64 is as follows. Take the Fibonacci extension tool on your chart platform and begin at the point of the March 2009 lows. From there go up to the point of the red I peak then back down to the red wave II low. That will give a target extension area where the current red wave III is equal to the red wave I at 62.64.
As mentioned that is where the target area begins. Higher would be more preferable as we sometimes see a wave III reach the 161.8 Fibonacci extension or greater. Once it ends it will only be expected to correct the cycle up from the March 2020 lows. This should be in a relatively shallow .236 to .382 Fibonacci retracement of the wave III cycle. Afterward it will be expected to be turning higher again.
