Since the crash of March 2020, all stocks have tried to recover what they lost and PG was no exception. PG did not only recover the lost, but It also reached historic highs. We are going to try to build an impulse from wave II when it is completed with a target around to $167.14 – $173.32.
PG Daily minutes Chart
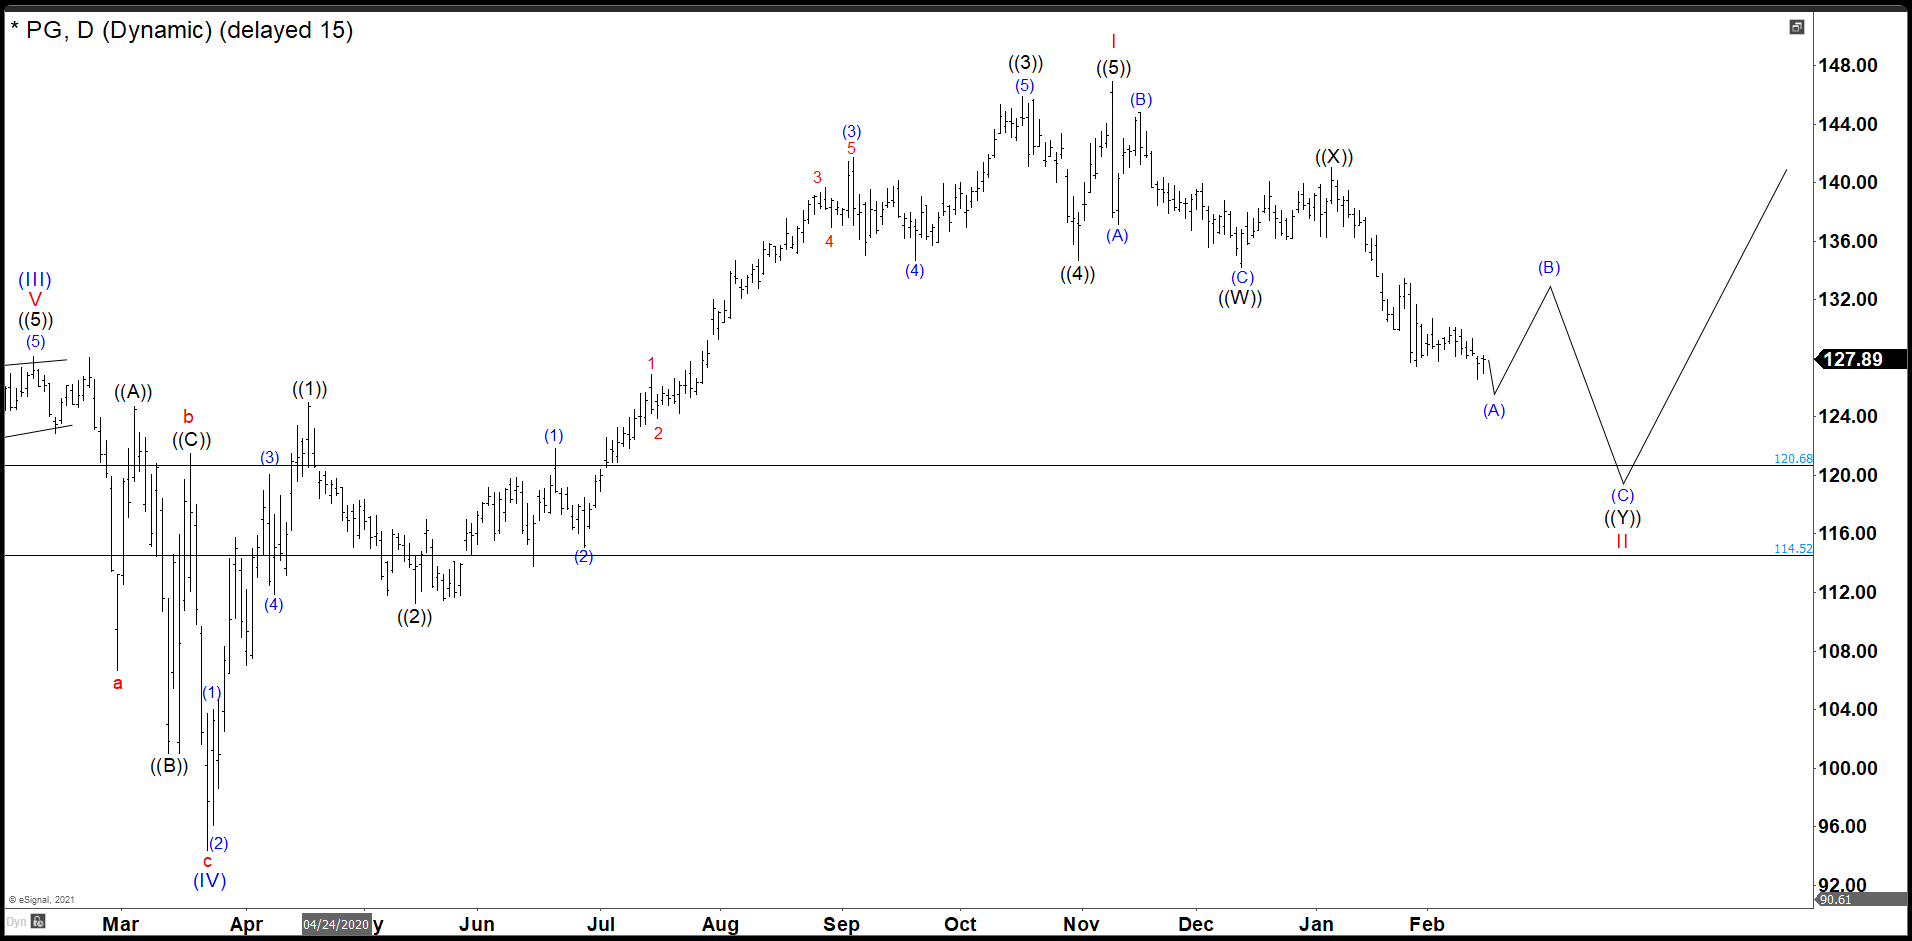
As we see in the daily chart, PG built an impulse ((1)), ((2)), ((3)), ((4)), and ((5)) that we call I in red and it ended at 146.92. Since November, the stock has dropped only. We see 3 swings down (A), (B), and © as wave ((W)) and then a wave ((X)) as a corrective structure.
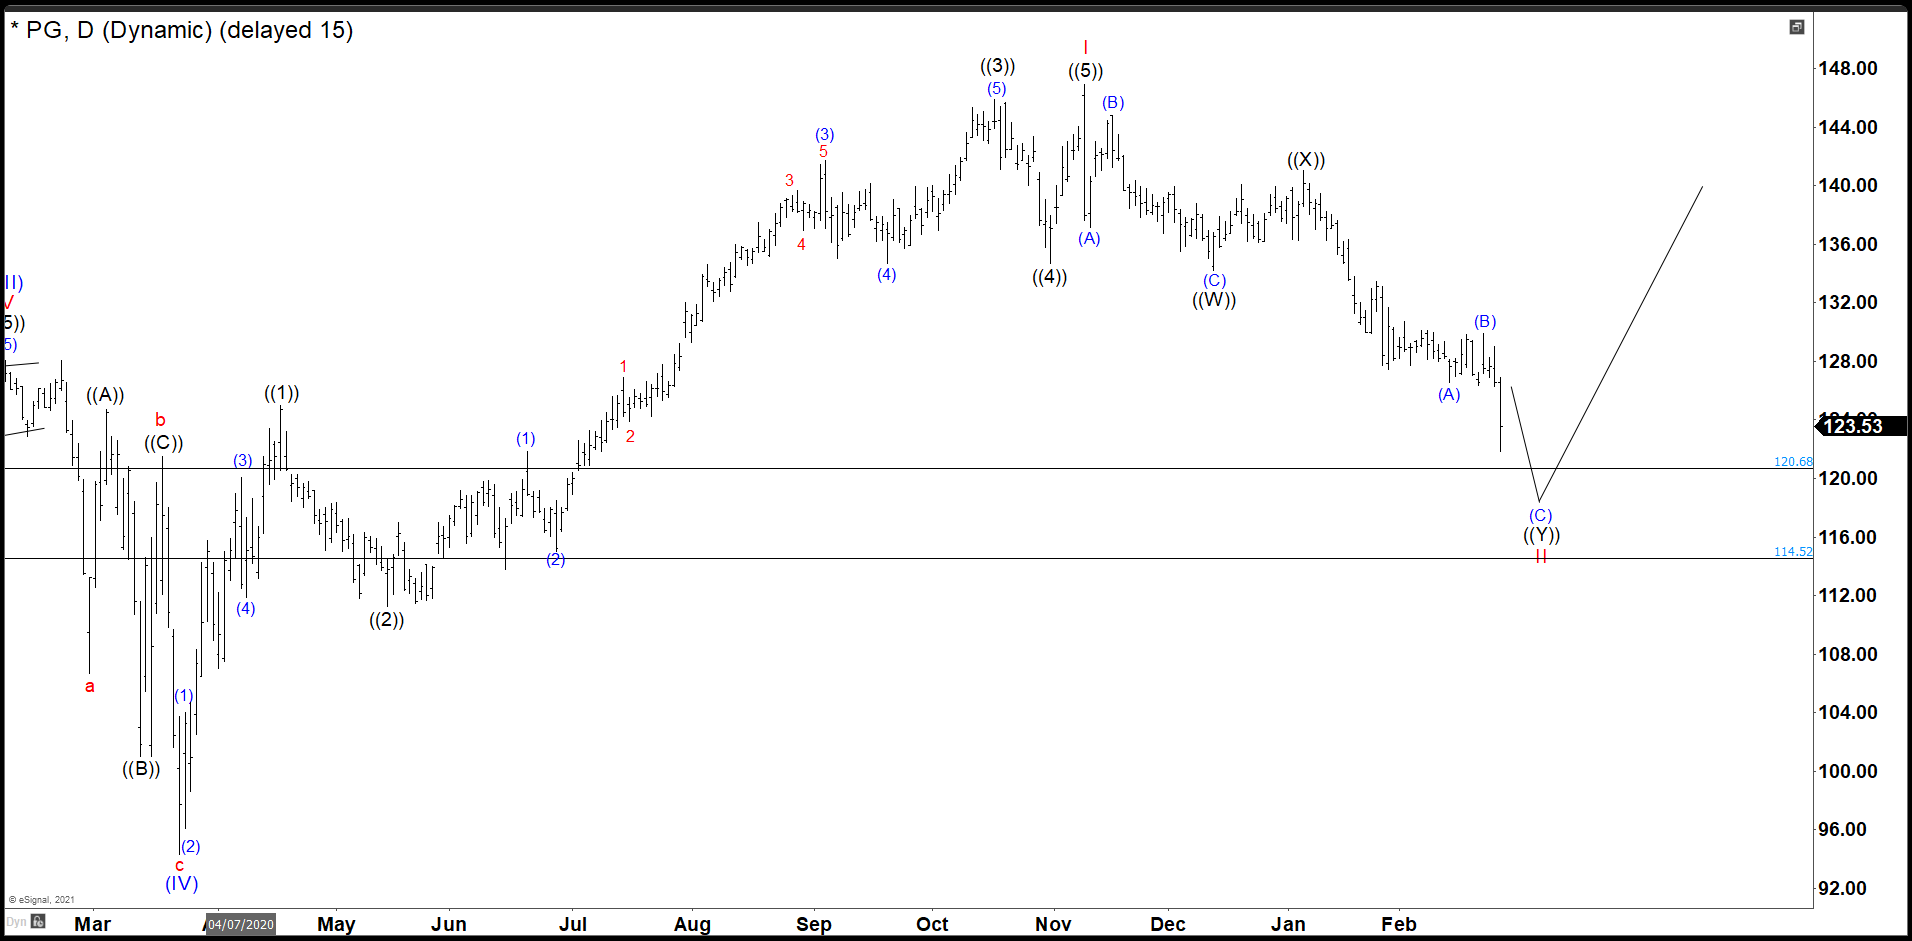
We are looking for 3 more swings down to complete wave ((Y)) and II as a double correction in $114.52 – $128.68 area, it could be lower, but for now is the ideal one. Waves (A) and (B) culminated and now we are developing wave ©.
PG 30 minutes Chart
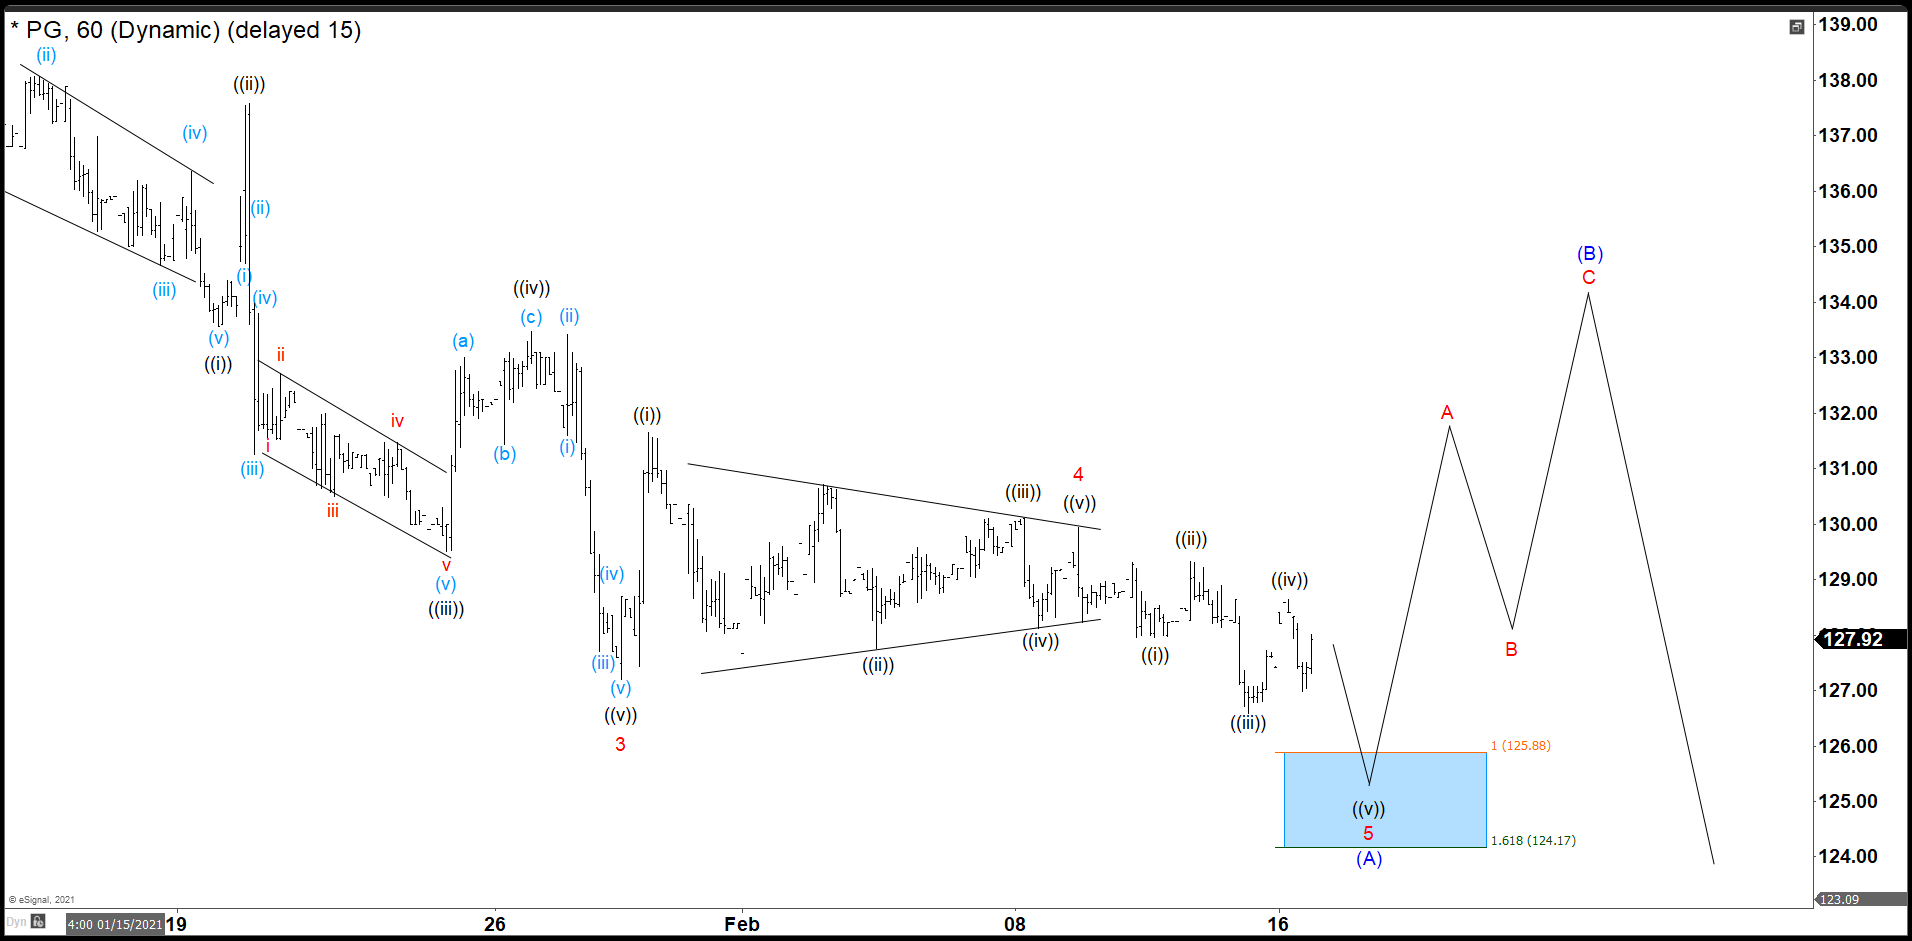
Two weeks ago, we expected one more low to complete wave (A) and then a bounce as zig-zag correction to complete wave (B) before continue lower. (If you want to learn more about Elliott Wave Theory, please follow this link: Elliott Wave Theory).
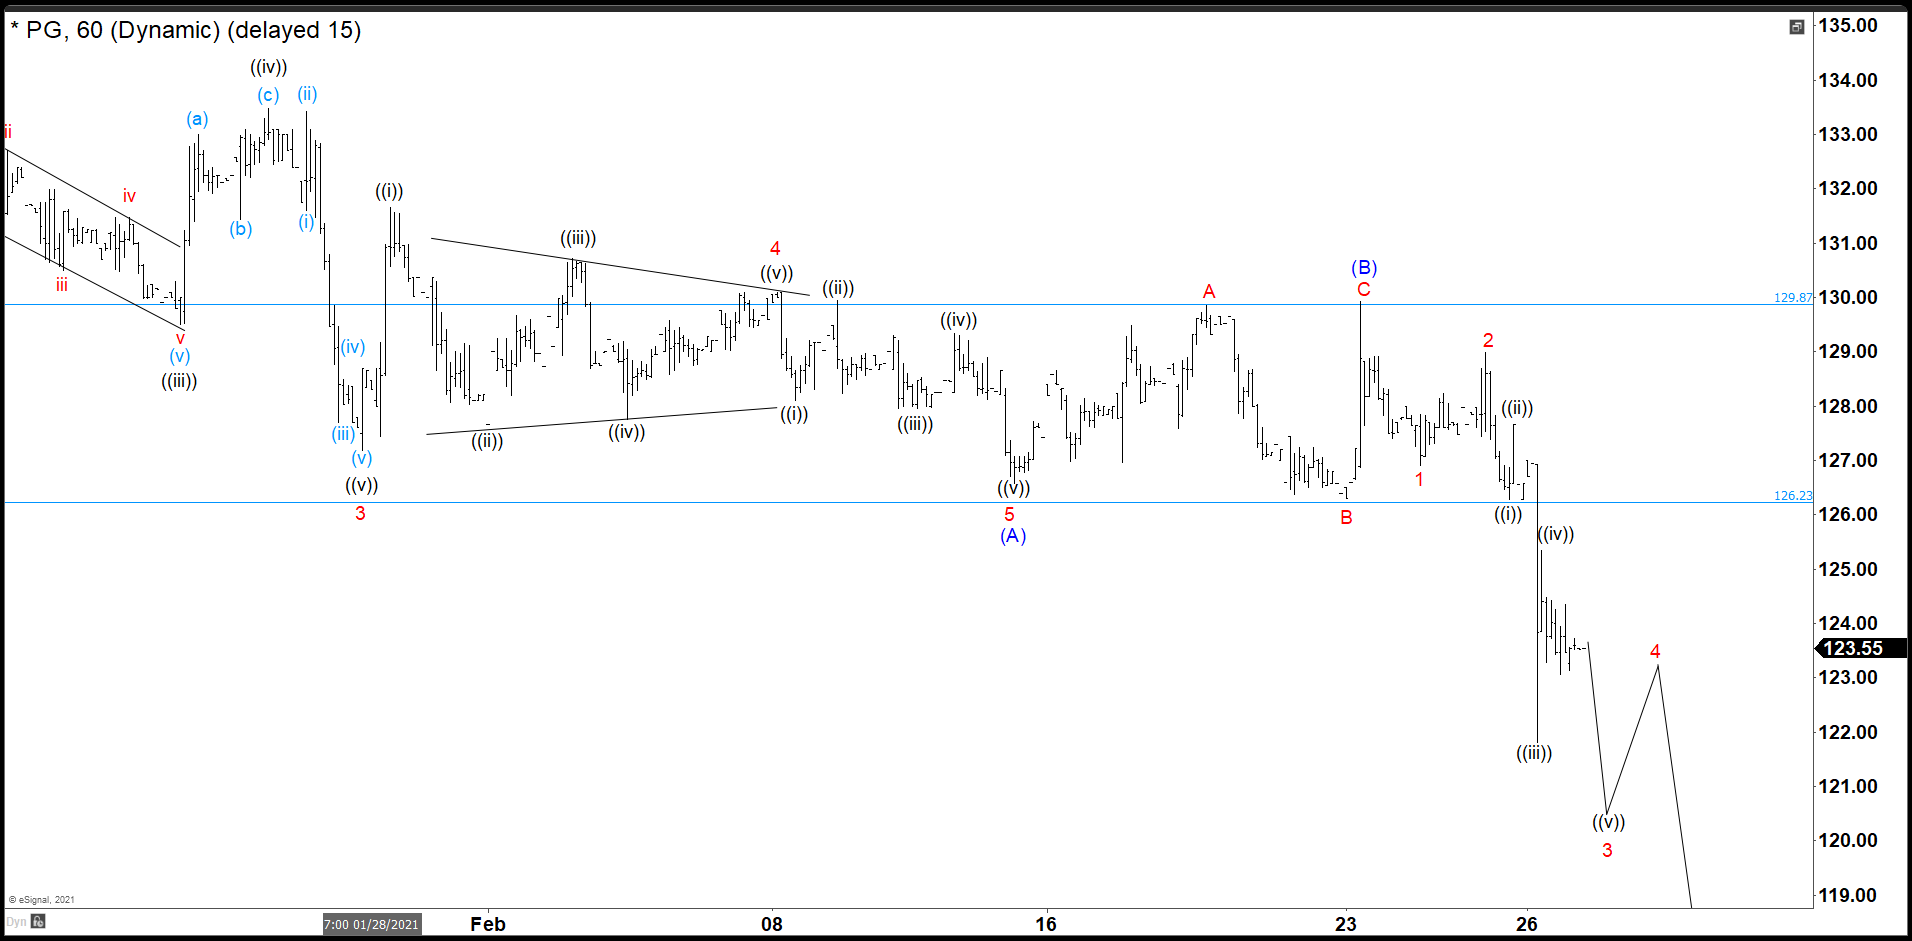
The market did not make one swing lower and begin to range completing the wave (B) as irregular flat structure. The last days of the week, P&G continue with the downtrend and it seems is developing an impulse structure. We are in the wave 3 and we need one more low to finish it, then a pullback to build wave 4 and a last dip to complete the impulse that it should bounce in the $114.52 – $128.68 area.
Source: https://elliottwave-forecast.com/stock-market/pg-continue-lower-expected/