Phoenix Foundation

This thread is intended for the presentation of the system I trade nowadays. The basic structure of the system is not my own but rather an adaptation of the 3 Ducks’ Trading System: 301 Moved Permanently

There are several beauties of the 3 Ducks’. First and foremost it is the simplest and most efficient way I’ve yet seen to make sure you’re trading with the trend. It allows you to trade only if price is with the trend on all of the three timeframes.

I realized quite some time ago that a trading system has to be adapted to the conditions of your life. Many, including me in the past, try to do it the other way around - which doesn’t work.

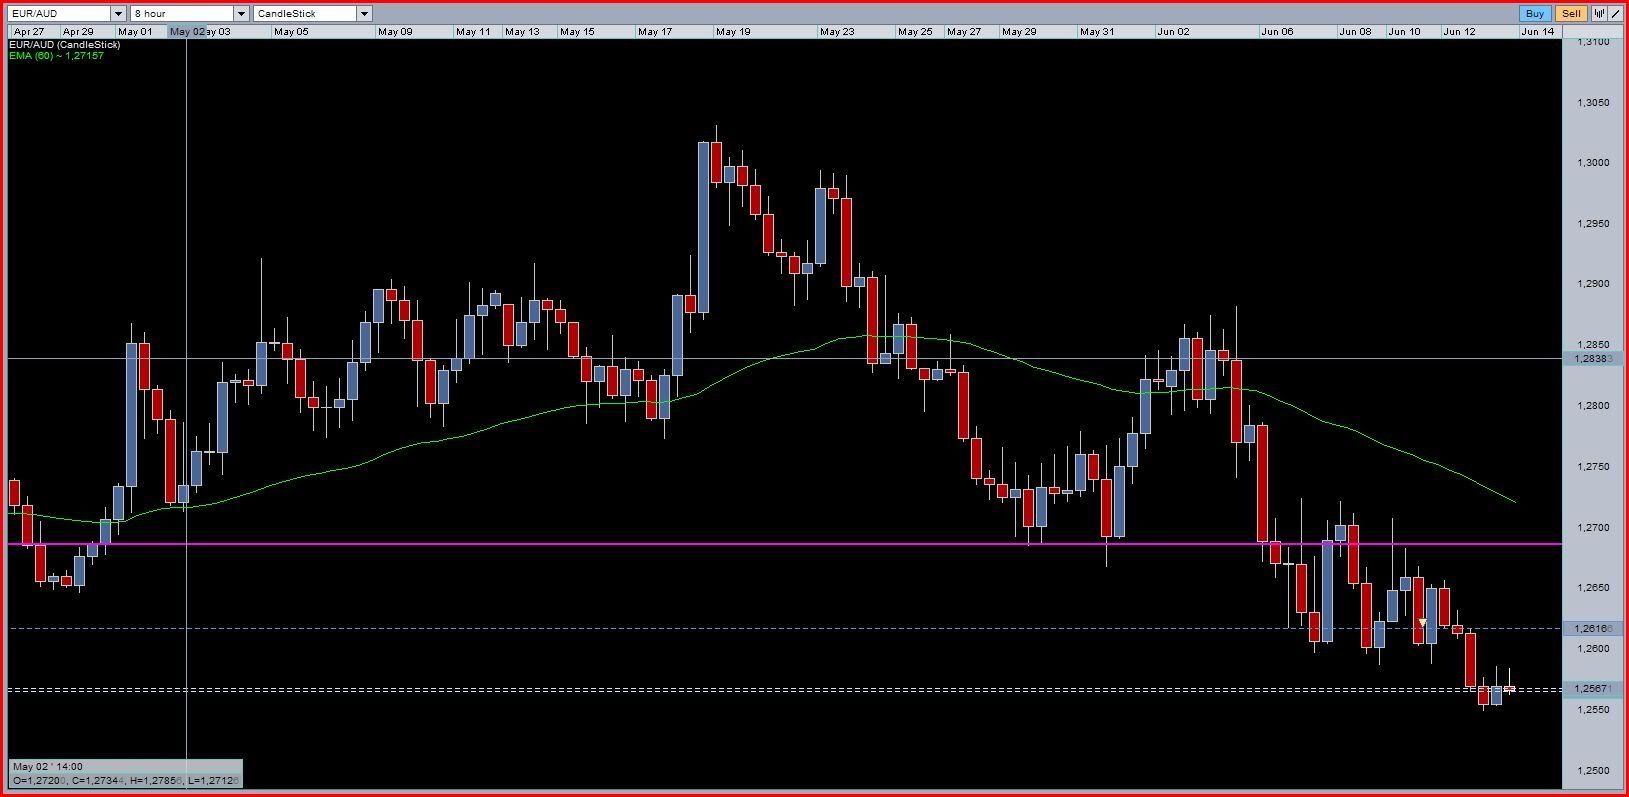
For a long time I believed I could trade 4H charts, thinking it shouldn’t be a problem finding time to check on the charts once every four hours. Working full time as I do with patients and meetings etc this turned out to be impossible. I have always felt that daily charts demand too big stop losses and too few trades, so that wasn’t right for me either. The solution that I’ve found works for me is 8H charts which Oanda’s FXTrade platform offers. The MT4 platforms has a very poor choice of timeframes in my opinion and I’m not fond of it generally either. Once FXTrade starts offering the Weekly timeframe I’ll uninstall MT4 as I’ll have no use at all for it then.

So, I started combining the 3 Ducks approach to the higher timeframes. Since I wanted the 8H to be my trigger timeframe it was inevitable really for Daily and Weekly to be the two other Ducks for me.

I felt that the trigger that the original 3 Ducks uses is less well suited for the higher timeframes where bar formations often are quite reliable, especially when they’re in the direction of the trend.
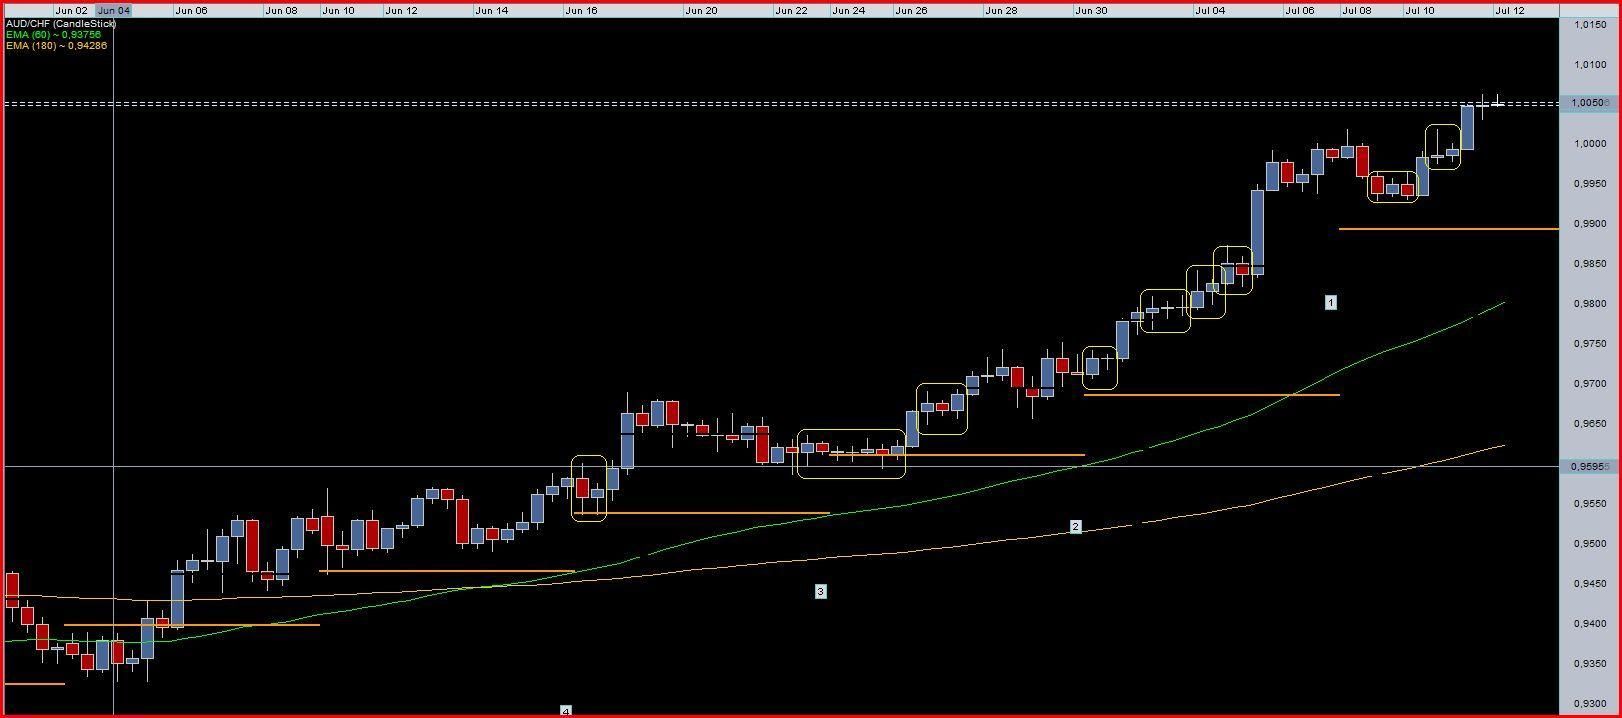
Therefor I use Inside Bars, Outside Bars, Pinbars, Trendline breaks or S/R as my triggers. Inside bars would have to be the favourite thanks to the risk/reward they offer.

Another small change I made from the original 3 Ducks is that I use the 60 EMA instead of the 60 SMA.

Finally I’ve added one more filter to further increase the trend following properties of the approach - I also place a horizontal line to mark the pivot of the previous week.

So, for example, in order to take a long trade, these are the requirements:
Price must be above 60 EMA on the Weekly timeframe
Price must be above 60 EMA on the Daily timeframe
Price must be above 60 EMA on the 8H timeframe
Price must be above the pivot of last week (high + low + close)/3
We must have an entry trigger

Very simple really. And yet consistently profitable according to my backtesting and my live trading.

Needless to say, take profit should always be larger than the stop loss and somewhere shortly after the trade has gone into profit the same amount as your stop loss it’s a good idea to move the stop loss to break even.

Well, got stopped out at BE on EURNZD short which was 100 pips + before the weekend. Spanish bastards. :slight_smile:

Hi Magnus
Interesting I like these simple effective strategies, I’d like to implement only I do not have H8 in my mt4.
I’ll follow and see how the journey unfolds.
Henry

Improved multi-timeframe/offset/chart period converter, P4L PeriodCon.mq4 @ Forex Factory

A method for getting 8hour charts in metatrader. I haven’t tried it but you might want to.
Also something like this might work.

Custom Candle MT4 Indicator - Free Download

Hey guys.

I’m not certain what else to do with this thread, but I’ll try to post some trade examples. No cherry picking, there will be winners as well as losers.

I do have one issue which I have yet to figure out the best answer to: Does it really pay to move to BE around 1R, or is it better to just let the trade play out by either hitting SL or TP?
The answer is perhaps not as obvious as one thinks at first?

For instance, instead of having been stopped out at BE on the EURNZD short, I would have been still in the trade at around +100 right now if I had left the original SL alone. This phenomenon will happen sometimes and the question is if the losses it helps avoid are greater than the profits it cuts short?

do you close half and then move to BE and leave the rest?

No, I find that scaling out is a bad strategy. It decreases profitability, at least for me. Not to mention that it adds unnecessary trade managing.

This afternoon I noticed Oanda up-graded FxTrade, finally they have weekly bars! They also added 2-hour, 6-hour and 12-hour bars, how sweet is that?

PS: I really like how you adopted the “ducks concept” into a method that fits your work/real life schedule, nice. I was wondering, have you back tested the method without using the weekly time frame? I have a hunch using just the 60ema on the daily and 8-hour will give you more trading opportunities and you’d still be on the right side of most of the major trading trends. Just a thought…:wink:

I just returned from a few days holiday & you have a new thread started. Congratulations on settling on a system you are comfortable with. I will follow along with interest to see some chart examples. Good luck!

OOPS sorry I spoke too soon, overnight Oanda rolled back to the older version. :17:

Apparently there was a problem with the new version. Hopefully Oanda will take care of it quickly and we’ll be able to enjoy the new time frames.

I was looking for those and didn’t see them. hopefully they will get it fixed.

I was just about to complain bitterly about Oanda Europe lagging behind on the updates to the platform :slight_smile:

These changes have been about for some time on the demo platform so I’ve been waiting eagerly, guess I’ll have to keep waiting for a few days or so.

Thank you!

I haven’t done any testing other than eyeballing charts when I started trying to mold the Ducks into something I could use. I did compare the difference between using, so to speak, one, two or all three ducks. I found that using just a single duck, aka timeframe, I would tend to get signals when price is just going sideways and both the price and the EMA and the previous weeks pivot are close together. These signals, apart from having a high failure rate, also had another problem that bothered me - they came about frequently even though there was no trend in price on that timeframe or even in the higher timeframes when I looked at those.

The choice between using two or three ducks is harder, I think just two ducks would probably work. But, using my brain for once, I realized it’s stupid to fix what ain’t broken, so I decided to simply follow Captain Currencies framework and keep a three timeframe system. Having added the pivot level as well maybe it’s now three ducks and a duckling though :wink:

Well, had I still been in the EURNZD short that would have been sweet of course, but as mentioned I was stopped out. This setup on EURAUD appeared and I set an order that was triggered. Since then it has been a little like watching paint dry. But like they say, we get payed for patience.

8H FXTrade chart:

http://i923.photobucket.com/albums/ad76/o990l6mh/8c6c372b.jpg


Stopped out again at BE, not long after I posted…

When I looked at one, two or three ducks - I hadn’t yet added the weekly pivot. The more I think about it, the more I feel some backtesting is in order. Just the 8H EMA along with last weeks pivot level may actually do the job.

Missed a textbook trade on EURNZD today. Missed it because I woke late and had to skip the charts in the morning. Very annoying.

I have been eyeballing a lot and am now considering seriously to remove the weekly timeframe and just use the daily and 8H EMA along with the weekly pivot. It seems like the results will be the same or even better. Will do some more eyeballing this weekend but I’m fairly certain this is an improvement and at the same time a small simplification.

Just reporting that I’ve backtested the removal of the weekly EMA and the results are actually better. Traded this last week according to the new approach and it does seem to work nicely. Only trouble seems to be that more pairs qualify so it becomes even more about picking out the best bar setups than before.

This will be my area of focus now for some time, working on my skills at picking out the very best bar setups at the best locations only.

In hindsight I took a long IB on AUDJPY that I shouldn’t have, but at the same time a short XAGUSD position that was indeed a good setup covered and then some.

I finally managed to pull myself together and post a chart. I’ve marked the areas I consider as interesting entry setups with yellow rectangles. I didn’t manage to take all of them, but some.

Thick yellow lines are the weekly pivots, green line is the 60EMA and the yellow is the 180EMA which I use as a proxy for the 60EMA on the daily chart. Not a perfect proxy, but close enough.

Trading is always work in progress, the journey is never over. Right now for instance I’m looking at double charts to determine if exchanging the EMAs for a 8H and a Daily Ichimoku cloud is worthwhile. The clouds offer fewer “whipsaw” periods than the EMAs it seems and they still catch the trends. I’ll be working with double charts for a while still, but I’m starting to lean toward the clouds. I can certainly see why it is said to mean “at a glance”. Flipping through the instruments is substantially faster. Historically my trading results would have been more or less the same if I had used the clouds instead of the EMAs. The common denominator is the weekly pivot which keeps me out of all kinds of trouble…

So, if there are Ichimoku clouds instead of EMAs on the next chart I post up here, you have now been warned.

AUDCHF 8H chart from Oanda FXTrade (click the link below for a bigger resolution image)


http://i923.photobucket.com/albums/ad76/o990l6mh/41068052.jpg