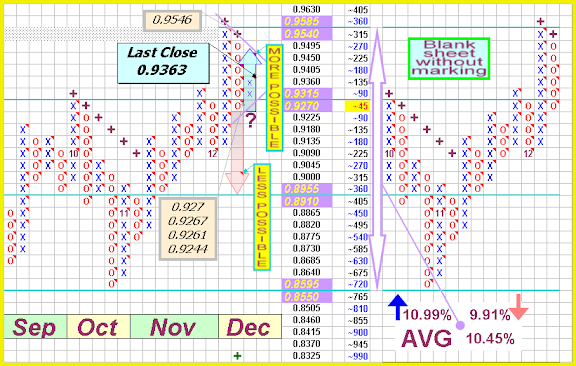
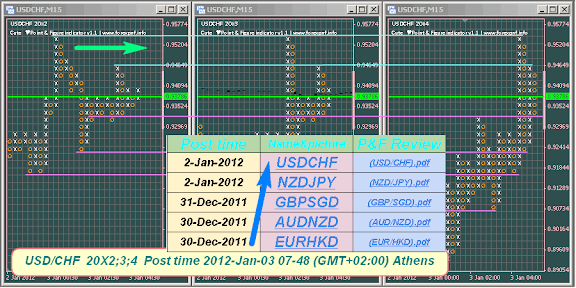
USD/CHF: The recent break above the critical October highs at 0.9315 is significant and now opens the door for the next major upside extension over the coming weeks back towards parity. A confirmed higher low is now in place by 0.9065 following the recent break over 0.9330, and next key resistance comes in by 0.9785. Ultimately, only back under 0.9065 would delay constructive outlook.[by dailyfx]
Learn more :
[B]A t t a c h m e n t[/B]
https://docs.google.com/leaf?id=0BxxKzvQ2GlM8YjZlZjI0NDktNmYyZS00Yjk2LWJhOTMtY2Y4ZWIwYzgzMjEz&sort=name&layout=list&num=50
USD/CHF: The recent break above the critical October highs at 0.9315 is significant and now opens the door for the next major upside extension over the coming weeks back towards parity. A confirmed higher low is now in place by 0.9065 following the recent break over 0.9330, and next key resistance comes in by 0.9785. Ultimately, only back under 0.9065 would delay constructive outlook.[By dailyfx]
CLICK HERE for detail information…
https://docs.google.com/leaf?id=0AhxKzvQ2GlM8dDBqYWl6XzlEbFZDWFVob0FMbG9nbGc&sort=name&layout=list&num=50
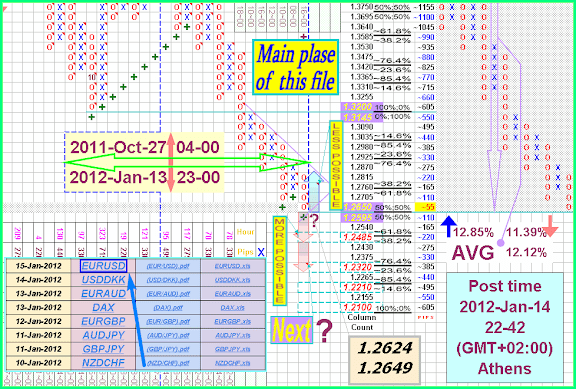
By FXEmpire.com – The EUR/USD pair was able to record some gains on Monday after the flow of upbeat fundamentals from the euro-area region, and also after Germany was able to sell bonds on a negative yield; however, after the European Central Bank announcement, which explained that European Banks’ overnight deposits at the ECB climbed again to all-time record, the pair surrendered some of the gains on fears an interbank lending freeze could hurt the financial sector and the region’s economy.

Learn more :
https://docs.google.com/leaf?id=0BxxKzvQ2GlM8ZDVmNTliNTUtMjcyNC00ZDg5LWI3YjYtOTcxYzYwYWY0ZTUw&sort=name&layout=list&num=50
A t t a c h m e n t (1)^^^ORvvv(2)
https://docs.google.com/document/pub?id=1Y5rnn301l8-O_xROiUY15UzqwhHoCWipS6mND6YTepY#id.dlcmsqbsh50f
EUR/USD rose during the Thursday session as traders celebrated successful bond auctions in both Italy and Spain. However, the recent downtrend is certainly intact, and it is hard to think that it suddenly will give way based upon these two sales. The 1.30 level above is the start of significant resistance, and we are looking to sell weakness in that area if it appears. The candle does suggest some possible follow through over the next day or two, but we aren’t willing to won the Euro in general and there are simply far too many problems in that part of the world right now. We are selling rallies going forward.[by forex-download]
Learn more :
https://docs.google.com/leaf?id=0BxxKzvQ2GlM8ZmRlMjViOTMtNjAyMS00NzUxLWFjMjEtODk0ZjFlNzg5YzQ5&sort=name&layout=list&num=50
A t t a c h m e n t (1)^^^ORvvv(2)
https://docs.google.com/document/pub?id=1Y5rnn301l8-O_xROiUY15UzqwhHoCWipS6mND6YTepY#id.dlcmsqbsh50f
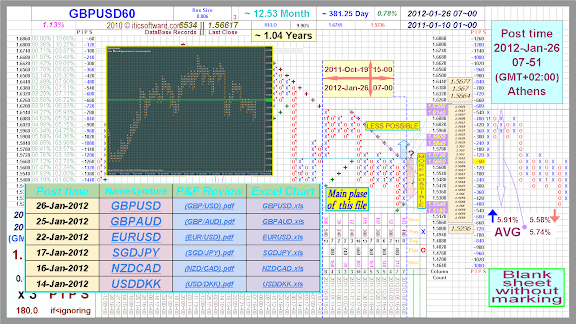
GBP/USD initially fell for the session on Tuesday, but found its footing later on and rose overall. The resulting candle is shaped much like a hammer, and is sitting just above the 1.55 level. The area now looks as if it could be supportive, and the pair looks destined to march north to the 1.57 - 1.58 resistance level. The pair is still in a bearish market, so we are cautious about buying, but if we were to do it - we would buy on the break of the Tuesday range to the upside, and be willing to take profit at 1.57 or so. Or better trade is to sell from that area on weakness, and that is how we wish to play this pair…selling between 1.57 and 1.58 on signs of weakness.[By ibtimes]
Learn more :
https://docs.google.com/leaf?id=0BxxKzvQ2GlM8ZGE3OWYxNTUtYmY5Mi00YWMzLWFkMmYtMDEwODRlMDI1N2Yw&sort=name&layout=list&num=50
A t t a c h m e n t (1)^^^ORvvv(2)
https://docs.google.com/document/pub?id=1Y5rnn301l8-O_xROiUY15UzqwhHoCWipS6mND6YTepY#id.iyuqgm7e6wl4
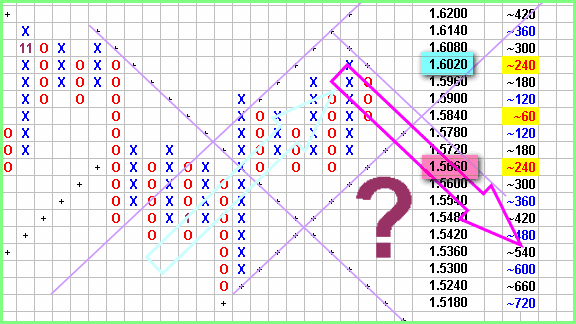
GBP/USD:The market has mostly been locked in some sideways chop over the past few weeks with any rallies very well capped ahead of 1.5800 and setbacks supported on dips below 1.5300. Until either side is convincingly broken, we would expect to see additional range trade. Therefore the preferred strategy is to look to buy range dips and sell by range highs. Only a weekly close above 1.5800 or below 1.5250 would give reason for outlook shift.[By dailyfx]
Learn more :
https://docs.google.com/leaf?id=0BxxKzvQ2GlM8ZGE3OWYxNTUtYmY5Mi00YWMzLWFkMmYtMDEwODRlMDI1N2Yw&sort=name&layout=list&num=50
A t t a c h m e n t (1)^^^ORvvv(2)
https://docs.google.com/document/pub?id=1Y5rnn301l8-O_xROiUY15UzqwhHoCWipS6mND6YTepY#id.iyuqgm7e6wl4
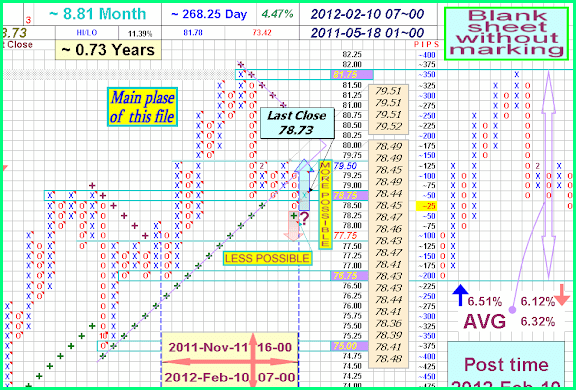
The dollar index DXY +0.13% , which measures the greenback against a basket of six currencies traded at 78.739, from 78.582 in late North American trading on Thursday. “Markets are limping into the weekend… price action has had a risk off feel to it,” said Sue Trinh, strategist at RBC Capital Markets.[marketwatch 2012-02-10]
Learn more :
https://docs.google.com/leaf?id=0BxxKzvQ2GlM8NGU4NjkxNmMtY2VmNC00Y2FkLWE2YTYtZDY2ZjhmZmY1YjQ5&sort=name&layout=list&num=50
A t t a c h m e n t
https://docs.google.com/leaf?id=0BxxKzvQ2GlM8ZWJmZDFjNTgtNGRmOC00MmI2LWEzODItZWE1NzNmOGQ5YWI1&sort=name&layout=list&num=50
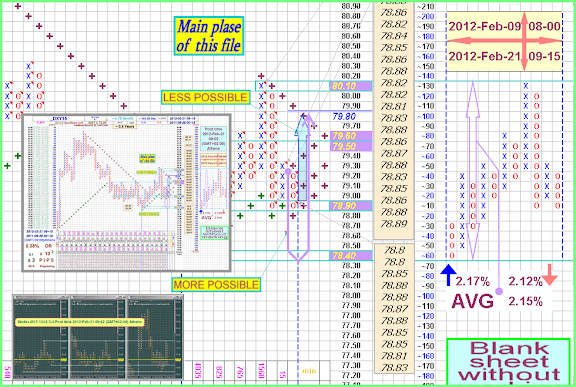
The dollar has risen versus its major currency counterparts despite a late week downside correction; this came after the heavily weighted EUR/USD currency pair rallied almost 200 pips on Thursday along with cable and other majors…[by forex-fx-4x]
Learn more :
^^^ORvvv
~~~>iticsoftware.com/postimages2//201009/12Feb08.html
On DXY if we get a pullback next week toward 78.50-ish we’d have a very mini head and shoulders bottom that could then manage to get up through this downtrend line/resistance. If I am wrong on this I think it’s that we cross the downtrend line, head toward the spike near 80 and then pullback to retest the downtrend line. Either way I continue to think the dollar moves higher for now.[By Real Money Pro]
Learn more :
https://docs.google.com/open?id=0BxxKzvQ2GlM8ZWJmZDFjNTgtNGRmOC00MmI2LWEzODItZWE1NzNmOGQ5YWI1
^^^ORvvv
http://img252.imageshack.us/img252/3377/12mar04.pdf
NZD/USD: After trading well into overbought territory, daily studies are finally starting to roll over to warn of a near-term top and bearish reversal. The latest break and close below 0.8250 confirms outlook and should now accelerate declines towards next key support by 0.8000 further down. Rallies should now be well capped ahead of 0.8300.

Learn more :
^^^ORvvv

```
https://docs.google.com/spreadsheet/pub?key=0AhxKzvQ2GlM8dDBqYWl6XzlEbFZDWFVob0FMbG9nbGc&output=html
```

[b]A t t a c h m e n t[/b]

```
https://docs.google.com/document/pub?id=1Y5rnn301l8-O_xROiUY15UzqwhHoCWipS6mND6YTepY
```
Much has been said about the ‘obvious’ H&S formation on the Daily chart. While I recognize this, I believe that said formation is failing with late week price action for which I am continuing longing even before the dreaded 1.3300. Again, there seems to be an inverted H&S on the H4 which pits it to the bulls. Break above Friday high would be above the neckline of said inversion and we should see some bullish action there off.[By forex4noobs]
LARGE PICTURE

Learn more :
^^^ORvvv

```

https://docs.google.com/open?id=0BxxKzvQ2GlM8ZmRlMjViOTMtNjAyMS00NzUxLWFjMjEtODk0ZjFlNzg5YzQ5

```


```

https://docs.google.com/document/pub?id=1Y5rnn301l8-O_xROiUY15UzqwhHoCWipS6mND6YTepY#id.4lkg9t4ejr1o

```
Over the last six months gains above 1.6000 have been limited and have attracted heavy selling. Sterling has fallen two big figures from this week’s high with the help of the QE3 postponement in the US. This weakness has caused the rate to fall back beneath the 100 day moving average at 1.5831. Strong US jobs data for March would undermine the rate further.
[by livetradingnews]
Learn more :
^^^ORvvv

```

https://docs.google.com/open?id=0BxxKzvQ2GlM8YzZjYTc3NGEtZDYzOS00ZTQwLWFmNTQtOGI4NWEyZDhkODU0

```

^^^ORvvv

```

https://docs.google.com/spreadsheet/pub?key=0AhxKzvQ2GlM8dDBqYWl6XzlEbFZDWFVob0FMbG9nbGc&output=html

```
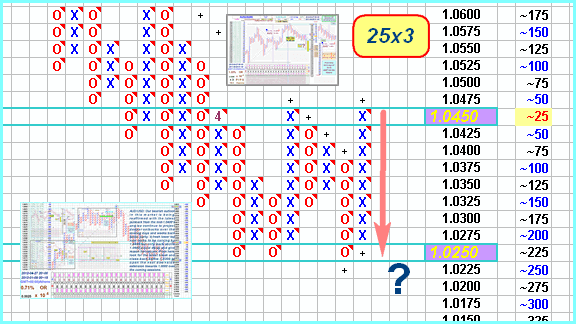
AUDUSD is in consolidation mode between 1.0245 and 1.0452 after taking out falling trend line resistance set from late February. We do not see an actionable trade setup here for now and will wait for the pair to offer greater directional conviction to look for entry opportunities.27 April 2012 09:33 GMT [By dailyfx]
Learn more :
^^^ORvvv
[B]A t t a c h m e n t[/B]

```

https://docs.google.com/document/pub?id=11KPAgRZ6MmReR4dTJfC1R-rot8T6uN2dNyKBOp_BKZU

```
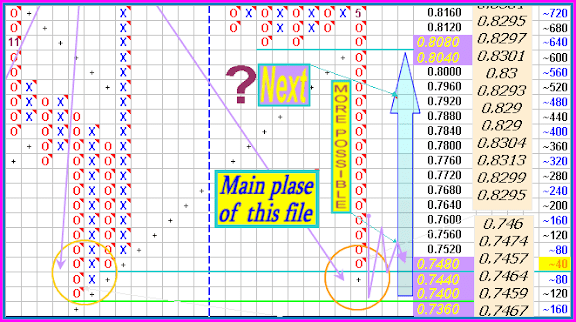
–The NZD/USD pair did very little at the end of the day on Friday. After first rising, and then falling – it never really went anywhere. The doji for the session shows how much trouble it is having as buyers try to prop the pair up at the 0.75 support zone.
–With the recent action, it looks as if the market is ready to fall again. The risks in Europe certainly have the markets in no mood to take on massive risk, so to think this pair would fall is hardly a stretch. On a daily close below the 0.75 level – we are sellers. Also, if we get a bounce, we are fading it on the first sign of weakness.[By fxempire]
Learn more :
^^^ORvvv
~~~>img834.imageshack.us/img834/669/12may27.pdf
^^^ORvvv

```
https://docs.google.com/spreadsheet/pub?key=0AhxKzvQ2GlM8dDBqYWl6XzlEbFZDWFVob0FMbG9nbGc&output=html
```
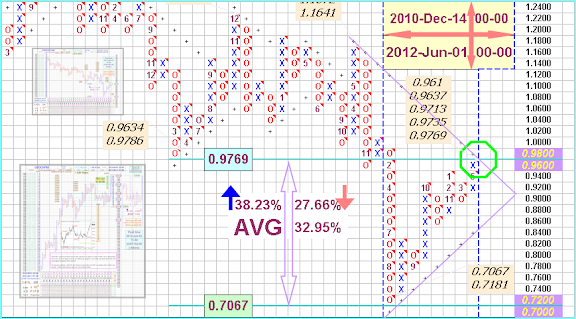
–USDCHF’s upward movement from 0.9043 extends to as high as 0.9769. Further rise is still possible next week, and next target would be at 0.9900 area.
–Support is at 0.9500, only break below this level could signal completion of the uptrend.
–For long term analysis, USDCHF has formed a cycle bottom at 0.8931 on weekly chart. Further rise towards 1.0000 would likely be seen over next several weeks.[Written by ForexCycle]
[B]↓Learn more!↓[/B]
https://docs.google.com/spreadsheet/pub?key=0AhxKzvQ2GlM8dDBqYWl6XzlEbFZDWFVob0FMbG9nbGc&output=html
See also:
http://img213.imageshack.us/img213/5037/12jun03.pdf
^^^ORvvv
https://docs.google.com/open?id=0B9cvIxidsTjvUGx6dktXRl8tTm8
–USD/CAD: Our core bullish outlook for this market has been more than reaffirmed over the past couple of weeks, with the market accelerating back above parity and towards 1.0500 thus far.
–While we continue to project significant upside over the medium-term, risks over the short-term appear to be tilted to the downside so that the market can correct from overbought readings on the daily chart.
–However, any setbacks should now be very well supported ahead of parity and in the 1.0100 area.[dailyfx]

[B]Learn more![/B]
https://docs.google.com/spreadsheet/pub?key=0AhxKzvQ2GlM8dDBqYWl6XzlEbFZDWFVob0FMbG9nbGc&output=html
See also:
>>12Jun11.pdf - Google Drive<<
>>http://img35.imageshack.us/img35/6121/12jun11.pdf<<
[B]A t t a c h m e n t[/B]
—Crude Oil Weekly P&F Technical Outlook.
…Crude Oil Maintains The Upside Bias.OPEC decision was so helpful for crude pushing it up to the top of the range that is expected to remain among it $80-$85, as the commodity is trading now around $84.66. But how long the upside momentum will last as the Greek elections at the door and no one knows how results will come. In fact, central bankers seem to be more mature than the market speculated before, as they stand ready to stabilize financial markets in a coordinated action to provide liquidity if the Greek elections on Sunday cause a mess in the market…[by oilngold]
[B]Learn more![/B] ↓↓↓
https://docs.google.com/spreadsheet/pub?key=0AhxKzvQ2GlM8dDBqYWl6XzlEbFZDWFVob0FMbG9nbGc&output=html
See also:
^^^ORvvv
~~~>img717.imageshack.us/img717/6808/12jun17.pdf
^^^ORvvv
[B]A d d i t i o n a l l y[/B] ↑↑↑
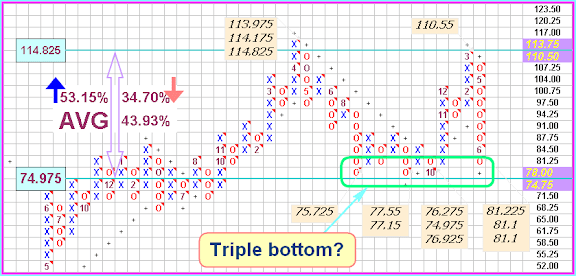
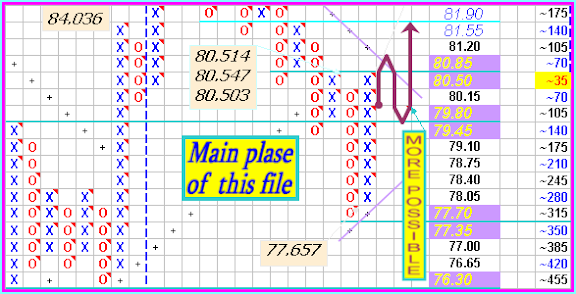
–The USD/JPY pair shot straight up during the week as the dollar found its footing against most currencies for the week.
–The 80 handle continues to be the epicenter of resistance for our money, and has still price down.
–The level won’t be considered broken out of it until we cross and close above the 80.50 level.
–This area is a clear top to the resistance area on the daily charts.
–Because of this, we are not ready to go along yet but believe that a break of the top of this week’s candle would be an excellent buy signal.
–As for selling, we are looking to do that now. [By FX Empire Analyst]
> > Click to learn more! < < ↓↓↓
>>https://docs.google.com/spreadsheet/pub?key=0AhxKzvQ2GlM8dDBqYWl6XzlEbFZDWFVob0FMbG9nbGc&output=html<<
>>https://docs.google.com/open?id=0B9cvIxidsTjvdktmX0NlcnJWMHM<<
>>http://img401.imageshack.us/img401/9310/12jun24.pdf<<
A d d i t i o n a l l y ↑↑↑
The Dollar Index (DXY), which Intercontinental Exchange Inc. uses to track the greenback against the currencies of six major U.S. trade partners including the euro and the yen, advanced 2 percent, the most since December, to 83.285. It touched 83.431, the highest level since June 1.
Dollar Index [DXY]: This forum had the conviction to be a $ bull for the last 1 year or so when all expert commentary was bearish on the currency. The buck hasn’t disappointed by its performance either, having rallied from 73.26 in May 2011 to a close of 82.9420 last week, just under its previous high at 83.6700. Can the $ rally higher?
[B]> > Learn more! < <[/B] ↓↓↓
>>https://docs.google.com/spreadsheet/pub?key=0AhxKzvQ2GlM8dDBqYWl6XzlEbFZDWFVob0FMbG9nbGc&output=html<<
>>https://docs.google.com/open?id=0B9cvIxidsTjvMVFhZzFydUxfa3M<<
>>http://img195.imageshack.us/img195/2825/12jul07.pdf<<
[B]A d d i t i o n a l l y[/B] ↑↑↑
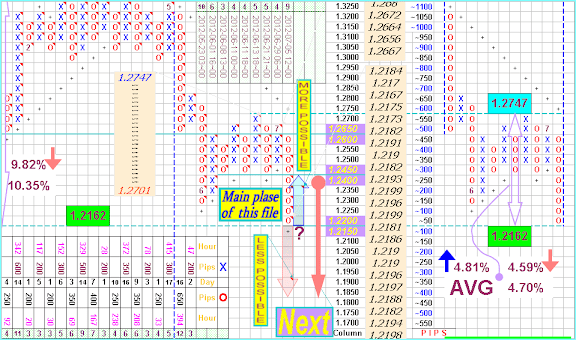
–EUR/USD Weekly Outlook and Trading Idea Outlook:
–As expected EUR/USD continued lower and almost reached the 1.2145 Fibonacci level (the low recorded last week was 1.2163).
–Now, despite the Friday’s bounce, the daily chart remains very negative and I expect further weakness.
–We may see some choppy sideways action first (most likely between 1.2145 and 1.2345) because the market has become quite oversold.
–Only a rise abv 1.2430/40 will negate the immediate bearish outlook and will risk larger recovery twd 1.2670 before the downtrend from the May 2011 top resumes…
–Strategy: Holding short from 1.2600 is favored. Stop=1.2450. [By ibtimes]
> > Learn more! < <
https://docs.google.com/spreadsheet/pub?key=0AhxKzvQ2GlM8dDBqYWl6XzlEbFZDWFVob0FMbG9nbGc&output=html
See also ↓↓↓
^^^ORvvv
~~~>_http://img694.imageshack.us/img694/7990/12jul15.pdf
^^^ORvvv
[b]A d d i t i o n a l l y[/b] ↑↑↑