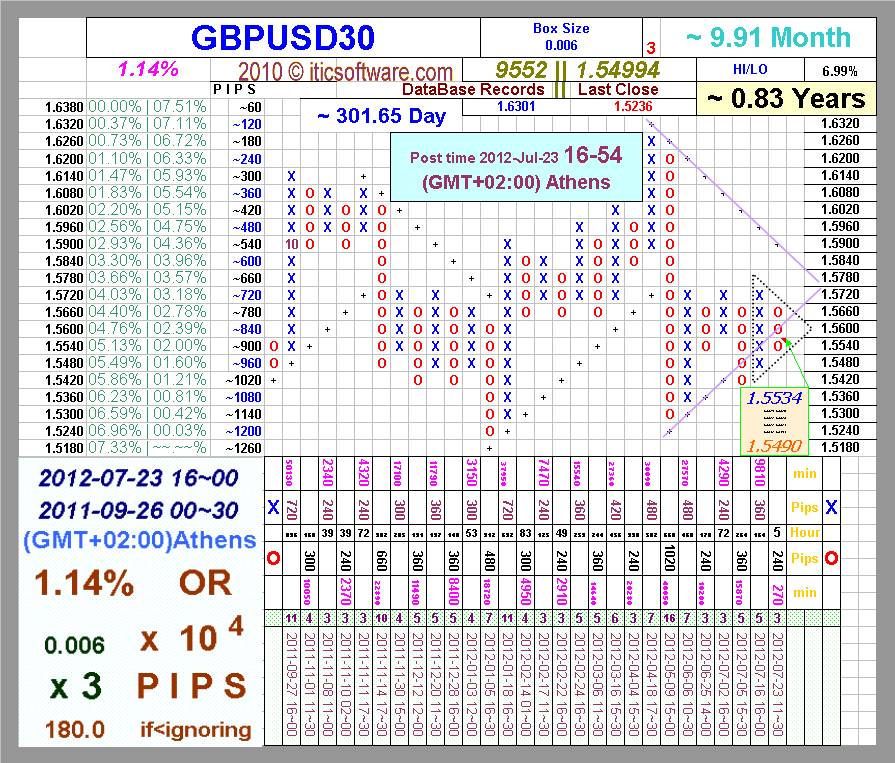
–Please note that overall GBP/USD has been in a very volatile sideways mode since January 2009.
–A break below 1.5269 and then the low of January 13th i.e.
–1.5233 may indicate a break below the lower support line.
–Please check this weekly chart of GBP/USD.
–Strategies for Trading GBP/USD (British Pound-Dollar): s mentioned above, our overall outlook for GBP/USD stays bearish but initially we stay neutral to expect some volatile sideway moves and even the possibilities of some further upward consolidation can’t be ignored.
–We are avoiding longs for GBP/USD right now, considering the overall bearish outlook.
–As mentioned above, initially we will be watching for the breaks of mentioned resistance and supports for the next week’s trade decisions.
– [By forexabode.]
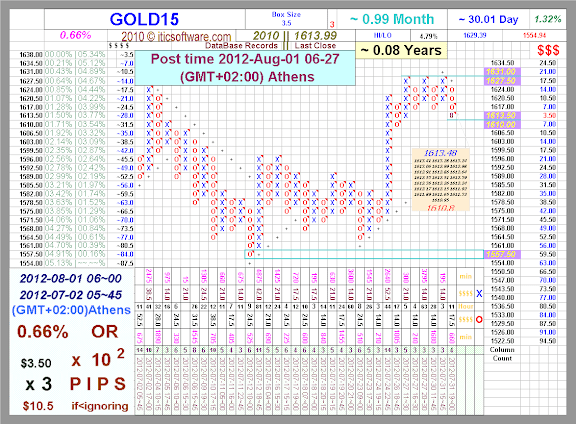
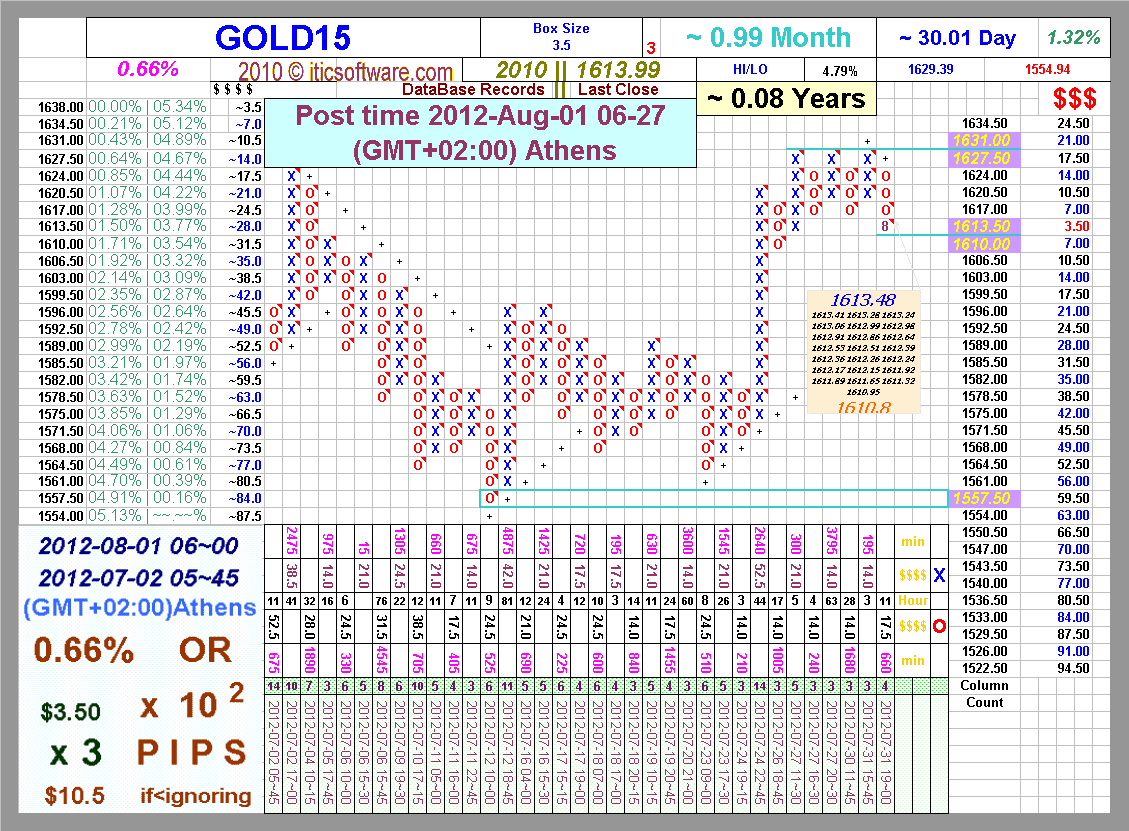
-GOLD: Although GOLD rallied sharply to close higher the past week, it remains trapped in a range between the 1,544.35 and the 1,640.45 levels.
-In order for the commodity to extend its upside it will have to break and hold above the 1,640.45 level, its range top.
-This if seen will open up further upside towards the 1,670.70 level and then the 1,700.00 level.
-Its weekly RSI is bullish and pointing higher suggesting further strength.
-The alternative scenario will be for the commodity to return to the 1,546.95 level on price failure where a violation will aim at the 1,527.05 level where a breach will resume its broader medium term weakness and then pave the way for further declines towards the 1,500.00 level.
-Price hesitation could occur here but if that level gives way, expect the commodity to decline further towards 1,478.05 level.
-All in all, GOLD continues to hold on to its broader medium term downside though trading in a range[Written by FXTechStrategy]
[B]vvv Click to learn more! vvv[/B]

```
https://docs.google.com/spreadsheet/pub?key=0AhxKzvQ2GlM8dDBqYWl6XzlEbFZDWFVob0FMbG9nbGc&output=html
```

[B]See also[/B]  vvv
~~~>_https://docs.google.com/open?id=0B9cvIxidsTjvczdYMzY1eGpWbXM
^^^ORvvv
~~~>_http://img819.imageshack.us/img819/7263/12jul30.pdf
[B]A d d i t i o n a l l y[/B]^^^
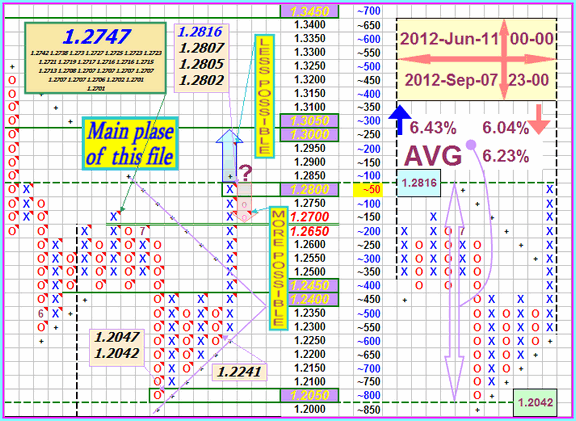
—The Australian dollar showed some movement in both directions but was almost unchanged over the week, as AUD/USD closed at 1.0399.
—Highlights of the upcoming week include Building Approvals and Private Capital Expenditure.
—The pair continues to trade in a narrow range following mixed economic releases in both the US and Australia, as the pair showed some fluctuation but was unable to sustain any breakout.
—I am neutral on AUD/USD.
—After impressive gains this summer, the aussie has been in a holding pattern for the past few weeks.
—Given the turmoil in Europe and mixed data out of the US and Australia, the choppiness could continue.
—However, if the US economy produces more weak data and there is further talk of QE intervention, look for the Australian dollar to make some gains.[Written by forexcrunch]
[B]> > Click to learn more! < <[/B]
could you please send me the software XLChartPro to my email ID (I sent on PM) or upload it on some sharing website?
Your link on yousendit has expired.
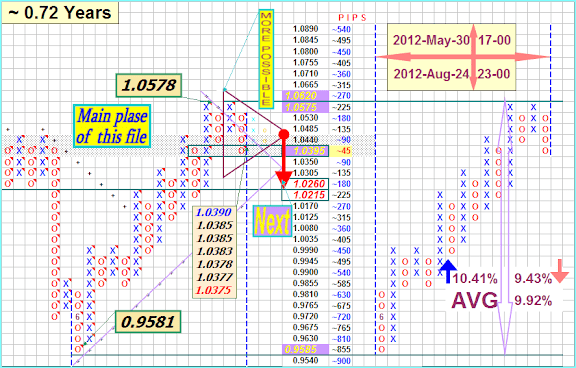
–Euro/dollar had a positive week, riding on the determination of the ECB in using its firepower to counter the Spanish crisis.
–The upcoming week is even more important, with the German constitutional court’s ruling needed to enable the bailouts.
–There are quite a few additional regular indicators and special events.
–Will the rally continue?.
–I am neutral on EUR/USD.
–After the huge rally that sent the pair to the highest levels since May, there is room for some correction.
–The rise came on a better than expected ECB decision, and high hopes for QE3 in the US.
–These hopes could lead to a disappointment, countering the big steps that Europe is taking to counter the crisis.
–Written by Forexcrunch.
[B]↓↓↓Click to learn more!↓↓↓[/B]
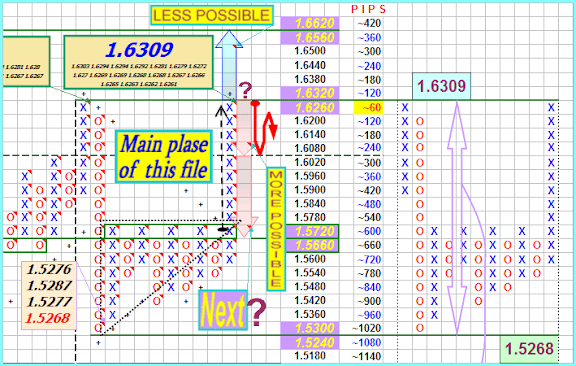
–The GBP/USD pair rose during the session on Friday and even managed to break through the 1.63 level at one point.
–However, by the end of the day we saw a pullback that formed a shooting star.
–This pair has been overbought for a while, and as such a pullback would be welcomed by many of the buyers at this point.
–We still see the 1.60 level was massively supportive at this point time, and hope that a pullback is a chance to start buying this market somewhere closer to that level.
–However, we managed to break the top of the shooting star from Friday, then of course is a massively bullish signal as well.
–Even if we do see a breakdown of price over the next day or two, we are not interested in selling as the central bank equation of this currency pair is pretty straightforward: the Federal Reserve is looking to expand its quantitative easing, and the Bank of England is looking to sit still with its rates.
–Because of this, there is a positive swapped going long this pair. [Written by fxempire]
[B]↓↓↓ Click to learn more! ↓↓↓[/B]
I use the average data high-low daily charts for 1000 records. Box Size X 3 Box Reversals = the average high-low.
And I also know Box Size = Stop Loss ; Box Size = 1/3 Stop Loss for Box Size X 3 Box Reversals.
Well, you can just try to talk round numbers, but it is somehow illogical …
I sometimes use round numbers 10,20,100 and so on for the review, when you need to give a general idea…
I know traders who trade intraday and use the point and figure chart.
I do not trade intraday.
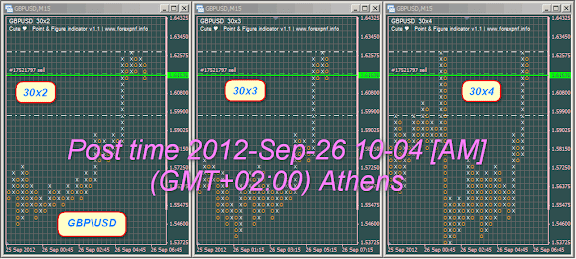
You can try this free indicator. This is a stable version. There is a more recent version of this indicator. Large Image
*if you’ve downloaded indicator with not suitable digits price for your platform, then go to _http://www.forexpnf.info ‘downloads’ section and download suitable version of indicator.)
*** Warning! Don’t run 4 digits price indicator on 5 digits MT4 and vice versa. This can take too much resources of your CPU, also can cause a crash of MT4.[/I]
[See readme.txt]
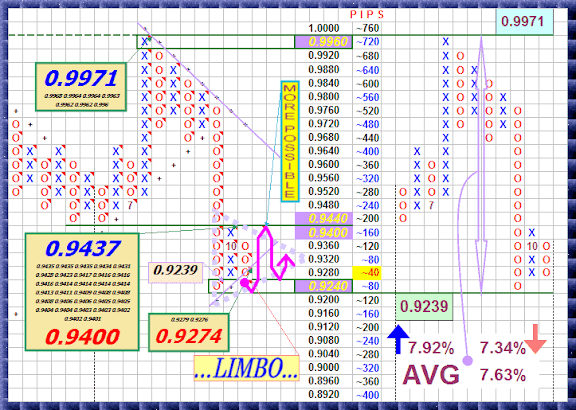
–USDCHF: With USDCHF reversing almost all of its corrective recovery gains the past week, the big risk is for it to return to the 0.9238 level.
–If this occurs in the new week, further declines will shape up towards the 0.9193 level, its May 07’2012 low with breach targeting the 0.9100 level and ultimately the 0.9000 level, its big psycho level.
–Its weekly RSI is bearish and pointing lower supporting this view.
–On the upside, it will have to return above the 0.
–9424 level to annul its current weakness and resume its bullish offensive towards its Sept 10’2012 high at 0.9482.
–A breach will open up further upside gain towards the 0.9606 level.
On the whole, the pair remains biased to the downside in the short term.
[Written by traderslaboratory]
↓↓↓ Click to learn more! ↓↓↓
Point & Figure techniques for Forex trading. The strategies work well, but they are designed for swing and position traders only. If you don’t want to hold a trade for at least 1-2 months, then you probably don’t like this one. However most of the profits are made on the long term. So for those that are looking for a good long term strategy, this one is a good choice.


