Precious Metals Updates by Solid ECN

Silver, the pair may fall.

On the daily chart, the first wave of the higher level (1) of 3 formed, a downward correction developed as the wave (2) of 3, and the third wave (3) of 3 forms. Now, the first wave of the lower level 1 of (3) has formed, and a local correction is developing as the wave 2 of (3), within which the wave b of 2 is ending.

If the assumption is correct, after the end of the correction, the price will fall to the levels of 24.18 - 23.52. In this scenario, critical stop loss level is 26.92.

Trade with a True ECN Broker
Solid ECN Securities

XAUUSD, flat dynamics in the short term

Gold prices are consolidating during the Asian session, holding near 1920. The day before, the instrument showed a rather active decline, which was caused by another increase in the attractiveness of the US currency for investors. The US dollar is strengthening amid expectations of further tightening of monetary policy by the US Federal Reserve, which may raise the rate by 50 basis points at once during the May meeting. In addition, the demand for the US currency is growing due to an increase in the yield of treasury bonds: for 10-year securities it rose above 2.55% for the first time since May 2019. Return of asset quotes above 1950 will provide stronger support for gold, which may then rush to last week’s highs around 1966.

In turn, the demand for gold as a safe-haven asset remains quite high amid the escalation of the conflict in Ukraine. Traders are disappointed in the negotiation process and no longer expect that the parties will be able to reach a peace agreement in the near future.

It is also worth noting that the London Bullion Market Association (LBMA) and the World Gold Council (WGC) intend to create a blockchain-based database that will allow tracking the origin and movement of gold bars around the world. The initiative is aimed at preventing trading in illegally mined metal. At the moment, the market is recording an increase in the number of bars with counterfeit stamps with logos of large manufacturing enterprises.

Bollinger Bands in D1 chart demonstrate a stable decrease. The price range is narrowing, reflecting the emergence of ambiguous dynamics of trading in the short/ultra-short term. MACD is going down, keeping a fairly stable sell signal. Stochastic, having retreated from its highs, shows an active downtrend, signaling in favor of the further development of “bearish” trend in the ultra-short term.

Resistance levels: 1930, 1952, 1974.2, 2000.
Support levels: 1900, 1877, 1860, 1840.

Trade with a True ECN Broker
Solid ECN Securities

Silver prices remain under pressure

During the Asian session, silver quotes are growing slightly, trying to recover from a sharp decline at the beginning of the week, which led to a short-term update of local lows since February 25. Yesterday, the XAGUSD pair showed a particularly strong decline, reacting to statements by members of the delegations of the negotiation process between Russia and Ukraine about achieving a “breakthrough” in discussions of the non-bloc status. At the same time, the most painful issues of the disputed territories remain open. According to the Ukrainian delegation, the discussion of the territories of the Donetsk and Luhansk People’s Republics should take place at heads of state, but so far, there are no prerequisites for a meeting between Vladimir Putin and Vladimir Zelensky.

Meanwhile, the demand for silver and gold as shelter assets remains quite high. According to analysts, global demand for silver has continued to grow steadily in recent years, and in 2022 it could reach a record level, catching up with such leaders as gold, palladium, or platinum. Analysts from the Silver Institute expect demand for the precious metal to increase by 8% for the year to a record of 1.112B ounces. On the other hand, silver is primarily an industrial material, and much will depend on the state of the global economy, which is now recovering but showing worrisome inflationary risks.

On the daily chart, Bollinger Bands are steadily declining. The price range is narrowing, reflecting the emergence of ambiguous trading dynamics in the short term. The MACD indicator is going down, keeping a strong sell signal (the histogram is below the signal line). Stochastic is also dominated by “bears,” approximately in the center of its working area. The current readings of the indicator signal in favor of the development of a corrective decline in the short and/or ultra-short term.

Resistance levels: 25, 25.35, 25.58, 26 | Support levels: 24.67, 24.42, 24, 23.6

Trade with a True ECN Broker
Solid ECN Securities

Gold, Fibonacci levels analysis

Daily overview
On the daily chart, the price continues to test 1921 (correction 50.0%), and the consolidation below it allows a decline to 1890 (correction 61.8%), 1850 (the area of ​​January highs). However, an ascending fan may prevent negative dynamics. The key “bullish” level is 1951 (correction 38.2%), supported by the middle line of Bollinger bands. Its breakout will give the prospect of further growth to 1990 (correction 23.6%), 2050 (correction 0.0%).

Technical indicators do not give a single signal: Bollinger bands are horizontal, Stochastic reverses upwards, but the MACD histogram decreases in the negative zone.

Weekly overview
On the weekly chart, the price tested 2033 (correction 0.0%) but is now correcting downwards. A break of 1890 (38.2% ascending fan line) further declines to 1835 (23.6% correction, middle line of Bollinger Bands). Otherwise, the quotes will be able to return to 1990 (upper line of Bollinger bands), 2033.

Technical indicators do not give a single signal: Bollinger bands are directed upwards, Stochastic is directed downwards, and the MACD histogram increases in the positive zone.

Resistance levels: 1951, 1990, 2050 | Support levels: 1921, 1890, 1835

Gold, the pair may grow

On the daily chart, the third wave of the higher level 3 of (5) develops, within which the wave iii of 3 forms. Now, the third wave of the lower level (iii) of iii is developing, within which the wave iii of (iii) has formed, the correctional wave iv of (iii) has ended, and the development of the wave v of (iii) is starting.

If the assumption is correct, Gold will grow to the levels of $2150 - $2200. In this scenario, critical stop loss level is $1890.

Trade with a True ECN Broker
Solid ECN Securities

Gold, rising US Treasury yields are pushing the instrument lower

Gold prices are developing “bearish” dynamics, testing the level of 1920.00 for a breakdown. XAU/USD builds on the downward momentum that was formed at the end of last week, when the US currency received support after the publication of a strong report on US Non-Farm Payrolls and an increase in Treasury yields amid market expectations of a tightening of the US Federal Reserve policy, which could become a catalyst for raising interest rates soon.

As expected, the economy created a little less than 500K new jobs, but at the same time showed a steady increase in Average Hourly Earnings and a drop in the Unemployment Rate from 3.8% to 3.6% (forecasts suggested a decrease to only 3.7%). Strong data confirmed the likelihood that the US regulator will decide to raise interest rates during its May meeting by 50 basis points at once. At the same time, markets are also reacting with a noticeable increase in the yield of US Treasury bonds: on 10-year securities, it rose to 2.414% on Monday morning after closing at 2.375% at the end of last week.

In turn, gold is still supported by the tense situation around Ukraine. The positive impetus received from the results of the next round of talks between the Ukrainian and Russian delegations in Turkey at the beginning of last week seems to have leveled off after the appearance of new evidence of the aggravation of the situation in certain territories of Ukraine and, in particular, in the Bucha district. Meanwhile, Western countries have announced their readiness to impose new sanctions against the Russian Federation, which threatens to further complicate the situation with rising energy prices. Against this backdrop, gold quotes will continue their uptrend, as investors will redirect their capital to safe-haven assets in order to minimize risks.

Support and resistance
Bollinger Bands in D1 chart demonstrate flat dynamics. The price range is slightly narrowing from above, reflecting ambiguous dynamics of trading in the short term. MACD is declining keeping a weak sell signal (located below the signal line). Stochastic, after a short rise at the beginning of the last trading week, is again reversing into a horizontal plane. It is necessary to wait for the trade signals from technical indicators to become clear.

Resistance levels: 1930, 1952, 1974, 2000 | Support levels: 1900, 1877, 1860, 1840

Trade with a True ECN Broker
Solid ECN Securities

Silver, the pair may fall.

On the daily chart, the first wave of the higher level (1) of 3 formed, a downward correction developed as the wave (2) of 3, and the third wave (3) of 3 forms. Now, the first wave of the lower level 1 of (3) has formed, and a local correction is developing as the wave 2 of (3), within which the wave c of 2 is forming.

If the assumption is correct, the price will fall to the levels of 23.52 - 22.73. In this scenario, critical stop loss level is 25.12.


Trade with a True ECN Broker
Solid ECN Securities

Central banks continue selling gold

Yesterday, the World Gold Council (WGC) provided a preliminary report on the market state. The organization noted that in the first quarter of 2022, there was a trend for the sale of physical gold from the reserves of central banks, and this is the first period since 2020 when such a trend has been recorded. Most actively in February, metal was sold by such countries as Uzbekistan and Kazakhstan. In particular, Uzbekistan reduced its reserves by 22 tons, and Kazakhstan – by 21 tons, and for it gold reserves became the lowest since 2020. Among the bullion buyers during this period, only India and Ireland were noted, which replenished their stocks by a modest 2.6 tons and 1 ton, respectively.

The US Commodity Futures Trading Commission (CFTC) data confirm the global sell-off trend. According to the report for the last week, the number of positions of buyers secured by money amounted to 84.554K, while the same figure for sellers reached 335.029K. At the same time, the weekly change in positions indicated an increase in sellers’ contracts by 772 and a decrease by 5.858K contracts among buyers.

The price is correcting within the local Triangle pattern on the daily chart. Technical indicators maintain a weakened buy signal: fast EMAs on the Alligator indicator have come close to the signal line, and the AO oscillator histogram has moved into the sell zone, having formed the first bars below the transition level.

Resistance levels: 1957, 2050 | Support levels: 1900, 1830


Solid ECN Securities

Silver prices are falling during the Asian session, correcting after yesterday’s attempt to grow. The instrument is now testing the level 24.2 for a breakdown and waiting for new signals.

The situation on the market is changing slightly since there are no prerequisites for the completion of a special military operation initiated by the Russian authorities on the territory of Ukraine. Moreover, the economic outlook is only worsening as more sanctions are imposed on the Russian economy. In particular, yesterday, the EU announced its intention to expand the list of goods banned from imports from Russia, but analysts report that this package of sanctions has not been agreed upon so far. The project involves a ban on importing coal and some agricultural products, in particular, potash fertilizers. Certain foodstuffs may also be subject to restrictions. According to experts, sanctions could cost the economy about 9B euros a year.

The pressure on the instrument’s position is exerted by the growth in the yield of US Treasury bonds. The minutes of the US Federal Reserve’s Open Market Committee (FOMC) published yesterday reflected the regulator’s readiness to accelerate the tightening of monetary policy, including through the launch of a quantitative tightening program. Similar sentiments can be traced in the speeches official representatives of the regulator, for example, Lael Brainard, who is known for her rather reserved position.

On the daily chart, Bollinger Bands are steadily declining. The price range expands, letting the “bears” renew local lows. The MACD indicator is falling, keeping a relatively strong sell signal (the histogram is below the signal line). Stochastic shows similar dynamics but is approaching the level of 20, which indicates that silver may become oversold in the ultra-short term.

Resistance levels: 24.42, 24.67, 25, 25.35 | Support levels: 24, 23.6, 23.32, 23

Trade with a true ECN broker
Solid ECN Securities

Gold, the pair may grow.

On the daily chart, the third wave of the higher level 3 of (5) develops, within which the wave iii of 3 forms. Now, the third wave of the lower level (iii) of iii is developing, within which the wave iii of (iii) has formed, the correctional wave iv of (iii) has ended, and the development of the wave v of (iii) has started.

If the assumption is correct, the pair will grow to the levels of 2150 - 2200. In this scenario, critical stop loss level is 1890.

Trade with a true ECN broker
Solid ECN Securities


On the daily chart, the development of the third wave of the higher level (3) of 3 started, within which the first wave of the lower level 1 of (3) formed, and a local correction develops as the wave 2 of (3). Now, the wave c of 2 is forming, within which the third wave (iii) of c is developing.

If the assumption is correct, the price will fall to the levels of 23.52 - 22.73. In this scenario, critical stop loss level is 25.12.

Trade with a true ECN broker
Solid ECN Securities


XAUUSD shows moderate growth during Asian trading, testing the level of 1960 again. The day before, the instrument has already made attempts to consolidate above it, having updated local highs from March 14. Gold prices briefly rose to a monthly high on fears of increased inflationary risks in Europe and the United States, which was the reason for the purchase of the metal, but closer to the end of the Monday afternoon session, the “bulls” lost most of their gains. Financial markets are under pressure from geopolitical tensions and the desire of central banks to tighten monetary policy amid soaring consumer prices and associated fears of a recession. This, in turn, continued to benefit traditional safe-haven assets and pushed spot prices higher into the area of 1958 - 1960. The US dollar is also stable and is hovering around high levels around 100 in the USD Index.

Tomorrow, investors are waiting for the publication of inflation data from the US. Despite a number of active measures taken by the US Federal Reserve to contain it, analysts expect the annual value to accelerate to 8.4% in March. The biggest contributor is likely to come from higher energy prices as commodity markets surged to new record highs due to the sanctions policy against the Russian economy. According to the published minutes of the meeting of the Federal Open Market Committee of the US Federal Reserve (FOMC), the regulator intends to reduce the balance sheet by 95 billion dollars every month, starting from May of this year, and accelerate the rate of interest rate hike to 0.50%. In general, officials are optimistic about changing the current parameters to fight inflation, believing that the US economy is strong enough not to experience a recession in the face of geopolitical tensions.

Bollinger Bands in D1 chart show moderate growth. The price range is slightly widening slightly but does not conform to the development of the “bullish” sentiment yet. MACD indicator is growing, while preserving a rather stable buy signal (located above the signal line). Stochastic is showing similar dynamics; however, the indicator line is approaching its highs, indicating the risks of overbought instrument in the ultra-short term.

Resistance levels: 1,974, 2,000, 2,015, 2,030 | Support levels: 1,952, 1,930, 1,900, 1,877


Trade with a true ECN broker
Solid ECN Securities


On Tuesday, the metal traded 1% higher, jumping toward 25.40 USD as traders sold the USD and bought everything else following the recent inflation report. The CPI for March came out above expectations and printed 8.5% yearly (up from 7.9% in February), while the monthly change jumped from 0.8% to 1.2%. However, the core CPI rose only a notch to 6.5% against expectations of 6.6% and actually decreased monthly from 0.5% to 0.3%, which could have been the main reason behind the euphoric growth of nearly every asset class.

“USD remains supported due to the Fed’s active monetary policy, but a lot has been priced in as regards monetary policy so that USD will probably find it increasingly difficult to appreciate further.” economists at Commerzbank reported ahead of the data, which came true.

Silver is now pushing toward the critical resistance of previous highs near 26.40 USD. However, if broken to the upside, further gains to 25.80 USD seem likely. Alternatively, if sentiment worsens again, we might see a drop to today’s lows near 24.80 USD, which might be the essential short-term support.


Trade with a true ECN broker
Solid ECN Securities


Silver prices show a weak increase during the Asian session, retesting the level of 25.5. The instrument has been developing a fairly active uptrend since April 6, retreating from local lows since the end of last month and receiving support from statistics on record inflation in the world. Given the high Consumer Price Index in the US, which reached 8.5% in March, as well as the growing geopolitical uncertainty against the backdrop of the development of the Russian-Ukrainian conflict and severe anti-COVID restrictions in China, the demand for defensive assets remains elevated.

Macroeconomic statistics released the day before showed an increase in annual consumer inflation in the US to 8.5%, which was a new record high for 41 years. At the same time, a sharp tightening of the US Federal Reserve’s monetary policy is expected in May: in addition to the expected rate hike by 50 basis points at once, a quantitative tightening program may also be launched to correct its balance.

Additional support for the metal comes from the prospect of a gradual lifting of COVID restrictions in China, while the restoration of industrial activity. The Chinese authorities announced the easing of a number of quarantine measures in parts of Shanghai, which will affect almost 5 million people, since there were no new cases of coronavirus infection over the past two weeks. Silver, unlike gold, is more actively used in industry, and therefore reacts sharply to such factors.

Bollinger Bands in D1 chart demonstrate flat dynamics. The price range remains practically unchanged, limiting the development of “bullish” dynamics in the short term. MACD grows, preserving a stable buy signal (located above the signal line). Stochastic is showing similar dynamics; however, the indicator line is already approaching its highs, indicating the risks of overbought instrument in the ultra-short term.

Resistance levels: 25.58, 26, 26.27, 26.57 | Support levels: 25.35, 25, 24.67, 24.42


Trade with a true ECN broker
Solid ECN Securities


XAUUSD is correcting upwards at 1973. Yesterday, the World Gold Council (WGC) published a report on the state of the market in Q1 2022, which noted a clear positive momentum for the price of the precious metal.

According to the published report, the main influence on the quotes was the increased demand from ETF funds and private investors. In particular, the volume of gold held by ETF funds increased by 269 tons in the quarter alone compared to data at the end of 2021, which is the most dynamic increase since 2020. In addition, the US Mint noted the increased interest of market participants in bullion gold coins in Q1 2022, with total sales of 518K troy ounces, showing a record pace since 1999.

High demand for contracts is also confirmed by data from the US Commodity Futures Trading Commission (CFTC). According to last week’s report, the number of net speculative positions in gold was 245.5K, well above the average of 200K at the end of January this year.

In addition, investors continue to evaluate data on March inflation in the United States, which reflected an increase in consumer prices by 8.5% in annual terms, which is the highest value since December 1981. At the same time, core inflation, excluding food and energy prices, slowed down somewhat compared to the February level. Now the market is waiting for decisive steps from the US Federal Reserve. In particular, the interest rate is expected to be raised by 50 basis points at once at the meeting in May.

On the daily chart of the asset, the price is correcting within the global rising channel, being near the resistance line. Technical indicators maintain the buy signal: fast EMAs on the Alligator indicator again began to expand the range of fluctuations in the direction of growth, and the histogram of the AO oscillator moved into the buy zone, forming the first bar above the transition level.

Support levels: 1958, 1915 | Resistance levels: 1983, 2050


Trade with a True ECN Broker
Solid ECN Securities


XAUUSD, The pair may grow.

On the daily chart, the third wave of the higher level 3 of (5) develops, within which the wave iii of 3 forms. Now, the third wave of the lower level (iii) of iii is developing, within which the wave iii of (iii) has formed, the correctional wave iv of (iii) has ended, and the wave v of (iii) is developing.

If the assumption is correct, the pair will grow to the levels of 2100 - 2200. In this scenario, critical stop loss level is 1890.45.


Trade with a True ECN Broker
Solid ECN Securities

Gold, prices are approaching $2,000 again

XAUUSD shows moderate growth during the morning session, updating local highs from March 14. The “thin” market encourages the purchase of safe assets, so the US dollar and gold strengthen their positions. The precious metal is moving higher for the second week in a row, as statistics on consumer prices in the US, where inflation in March reached 8.5% on an annualized basis, which is the highest since 1981, increases the attractiveness of XAUUSD for hedging risks in anticipation of the next financial crisis. The situation on the market changes little, as the news background after the Easter week remains quite calm.

Demand for the metal is supported by general tension, which is expressed primarily by investors’ concern about global inflation rates. Due to the military conflict in Ukraine and subsequent sanctions against the Russian economy, energy quotes rushed up sharply, which provoked an increase in consumer and production prices in the global economy, which had just begun to recover from the period of the coronavirus pandemic. Under these conditions, gold actively added in price. In turn, an increase in the yield of treasury bonds, as well as expectations of further tightening of monetary policy by the US Federal Reserve, is holding back “bullish” sentiment on the instrument. Monthly bonds showed the maximum increase, having added 8.68% and amounted to 0.4108%, while the yield on 10-year bonds increased by 2.01% to 2.864%.

Today’s macroeconomic statistics from China did not support the instrument significantly. GDP in Q1 2022 showed a slowdown from 1.5% to 1.3%, which, however, turned out to be noticeably better than the expected 0.6%, while in annual terms, the Chinese economy accelerated from 4.0% to 4.8%, ahead of analysts’ forecasts at 4.4%.

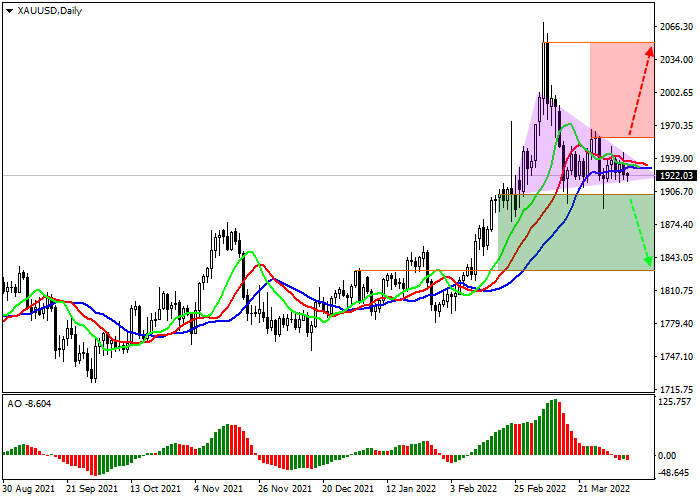
Bollinger Bands in D1 chart show moderate growth. The price range is expanding but it fails to conform to the surge of “bullish” sentiments at the moment. MACD indicator is growing keeping a buy signal (located above the signal line). Stochastic retains an upward direction but is located in close proximity to its highs, which indicates the overbought instrument in the ultra-short term.

Resistance levels: 2000, 2015.3, 2030, 2050 | Support levels: 1974.22, 1952.53, 1930, 1900


Trade with a True ECN Broker
Solid ECN Securities

Silver prices show a moderate decline during the Asian session, developing a strong “bearish” momentum formed the day before. The instrument is testing the level of 25 for a breakdown, updating local lows from April 12.

High US bond yields approaching multi-year highs (10-year bonds are trading around 2.95%), as well as the growth of the USD Index to the peaks of April 2020, are probably the main reasons why the “bulls” decided to take their profits. In addition, traders expect an early tightening of monetary policy by the US Federal Reserve. The rate hike by 50 basis points, as well as the launch of the quantitative tightening program are expected already during the May meeting of the regulator. What is more, St. Louis Fed Chair James Bullard said on Monday that he is open to the theoretical possibility of a rate hike of up to 75 basis points at once, although this will not be considered a “main scenario”.

Pressure on silver quotes is also exerted by not the most confident macroeconomic statistics from China. Data published earlier in the week showed a slowdown in Industrial Production in China in March from 7.5% to 5%, which, however, turned out to be better than market expectations at the level of 4.5%. Analysts attribute the slowdown in manufacturing activity in China to a new outbreak of coronavirus, as a result of which the Chinese authorities announced the introduction of quarantine in a number of provinces, following the policy of “zero tolerance”.

In the D1 chart, Bollinger Bands are reversing horizontally. The price range is almost unchanged, but it remains rather spacious for the current level of activity in the market. MACD is going down, keeping a fairly stable sell signal (located below the signal line). Stochastic shows a more confident decline, but is quickly approaching its lows, indicating the growing risks of the oversold pound in the ultra-short term.

Resistance levels: 25.35, 25.58, 26, 26.19 | Support levels: 25, 24.67, 24.42, 24

After reaching local highs of around 26 dollars per ounce, the quotes of the trading instrument show a local sideways trend and are now around 25.05.

The XAGUSD pair is preparing to continue growing against the backdrop of a positive report from the Silver Institute on the state of the precious metal market and experts’ forecasts for the current year. Thus, in 2021, global industrial demand amounted to 508.2M ounces, adding 9% to the value of the previous year, while silver bullion sales increased immediately by 36% to 278.7M ounces, the highest figure in the last seven years, and total demand for the year increased 19% to 1.05B ounces.

As for the forecast for 2022, analysts expect continued positive dynamics and investor interest in the assets of the metal group. Industrial demand for silver is estimated to increase by 6% to 539.6 M ounces, while overall supply could rise by 3% to 1.03B ounces. In general, the overall forecast for the year is positive, and according to the specialists of the Silver Institute, the deficit in the world market will be about 70M ounces.

The price moves within the global ascending corridor, declining after reaching the resistance line. Technical indicators keep a buy signal, but their readings work out a local correction: indicator Alligator’s EMA fluctuations range began to narrow, and the histogram of the AO oscillator forms downward bars in the buying zone.

Resistance levels: 26, 27.4 | Support levels: 24.55, 23.1

On the daily chart, the third wave of the higher level 3 of (5) develops, within which the wave iii of 3 forms. Now, the third wave of the lower level (iii) of iii is developing, within which the wave iii of (iii) has formed, the correctional wave iv of (iii) has ended, and the wave v of (iii) is developing.

If the assumption is correct, the pair will grow to the levels of 2100 - 2200. In this scenario, critical stop loss level is 1890.45.