I bought Martin Pring’s “Martin Pring On Price Patterns” and it is excellent in that each chapter explains a pattern and all of the variations and the more one reads the deeper he goes into analysis. But for PA Heroes the “Forward” in the book has a gem. Pring states that trading double tops & bottoms and head and shoulders in line with the general overall trend has a high probability of succeeding. Worth noting in my opinion. D.
Hello everyone,
I’ve been following this thread for the last few days (had to catch up by reading everything from the start).
But now that I’ve done that, I fell in love with price action. 
After millions of times of failing with indicators, I decided it’s time to start some price action trading.
However, I’m still a newbie at this and don’t know as much as I would like to, I can get very naive at times and just jump into trades but think that I can learn a lot along the way, so here I will post my first chart.

The pair I watched is the NZD/USD-4 Hour and I saw it hit resistance 3 times (marked with the white circles).
As soon as I saw it reached the resistance again today, I waited for a decline to form (a red candle) I jumped in at 0.7293 (red line), drew fibonacci and set my TP just above the 23.6 level at 0.7255 (blue line). Let’s see if I was right.
What do you guys think of my analysis? Feel free to be critical, I’m trying to learn as much as I can 
Welcome aboard and good luck. One thing I have learned with PA is that you don’t have to enter a trade immediately when it looks as if it will go your way. I use stop orders 10-15 pips away (on 4H or longer TFs) to make sure of the direction. That may not suit everyone but it works for me. Keep us posted on your results. d.
Hi Dobro,
Thanks for your quick reply.
But do you mean that you would place a market order 10-15 pips away onto the downside making you catch a little less movement or do you mean a stop-loss?
My stop-loss is at 0.7320, forgot to mention that 

As you can see USD/CHF has been moving side-ways for the past few days.
I placed a price alert at both sides and at that moment I will zoom in and see what happens so I can catch some pips :).
The reason why I’m posting this is because the naive me would sell the pair until a little above 1.0400. Would that have been justified?
(Just trying to figure out if the naive side of me can be right as well).
Yes, catch a few less pips but making sure the pr. is going my way. I don’t trade this way on the 1H or less however. d.

You were right Dobro, I got stopped out as the red candle turned into a green one and stopped out my trade at 0.7320.
But I do have a question about your method, as you say you probably would’ve entered a little lower around 0.7280 but where would you place your stop without losing your risk/reward ratio?
My SLs on longer TFs are 5-10 above the previous high; sometimes I even go back 2 or 3 candles if looks right to me - a judgement thing aka gut feeling.
I drifted away from this thread although I kept many of the ideas in my longer TF strategies but I would Like to know how you trade the one hour. Do you only trade a breach of the green/red S/R or if it touches and backs off then you wait for the next candle to confirm? I can see in hindsight some good trades but I haven’t been capable of finding them in real time, probably the reason I drifted away. I would appreciate any comments when you have the time as I won’t be trading again until next Tue. thank you, D.
Hi,
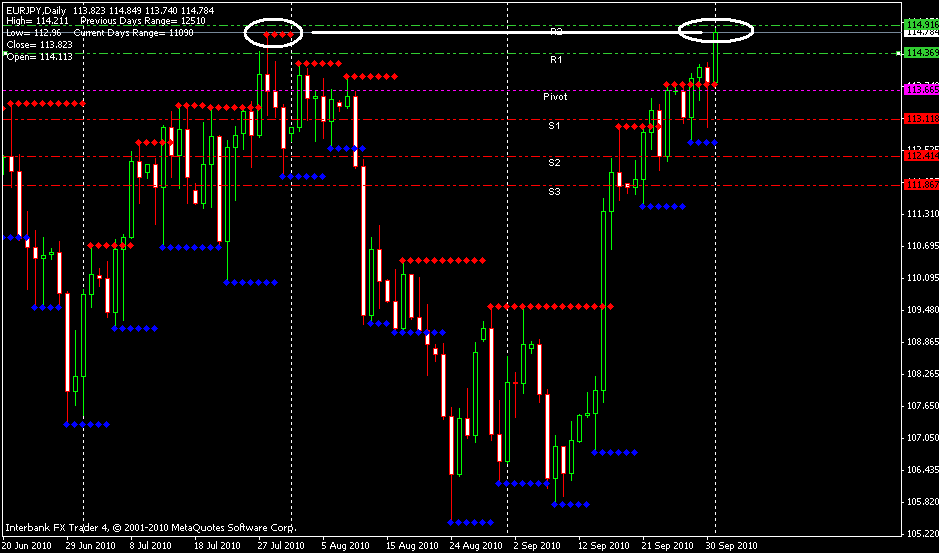
A look at EJ Daily Weekly Monthly charts. Weekly and Monthly charts shows priceaction encountering an area of resistance. Daily shows a possible double top. Is this a good area for shorting this pair ? Lets see what market holds for us tomorrow.
Regards,
Muthu.
Chennai.
India.
EJ Daily
EJ Weekly
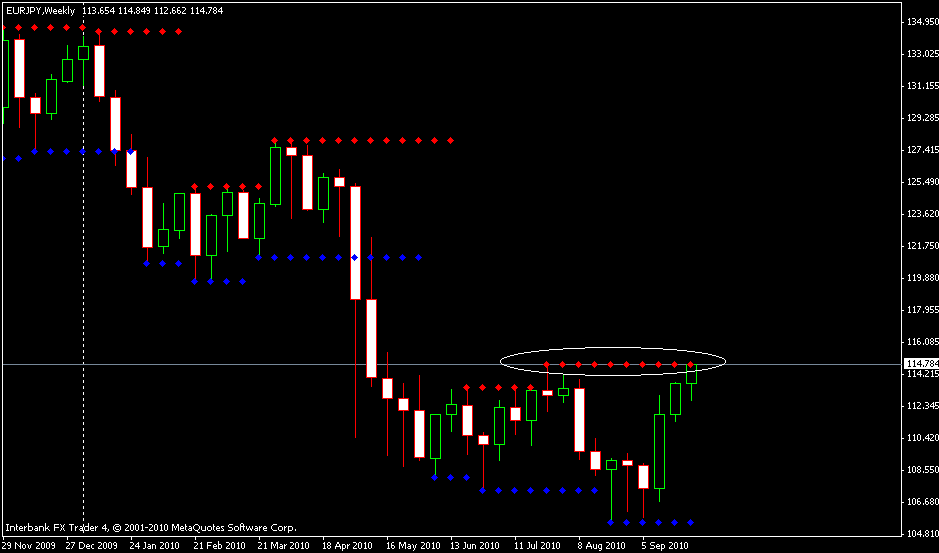
EJ Monthly

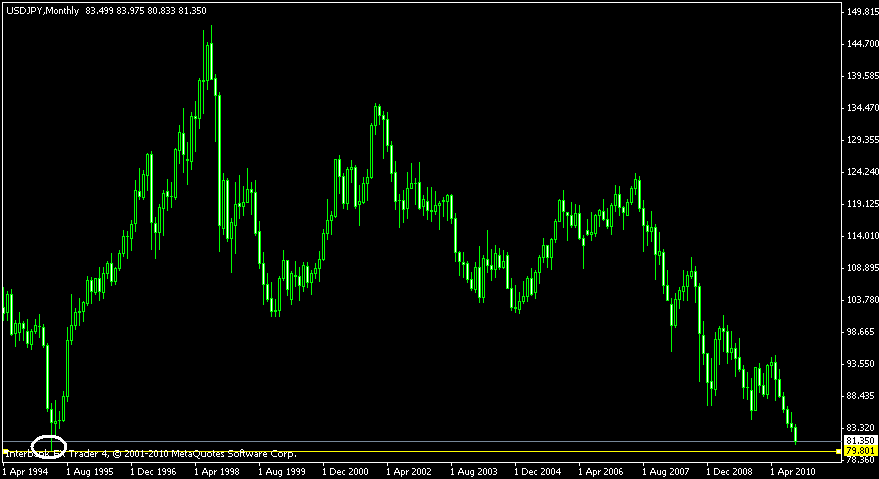
One of my friends that i spoke with made this observation that really interested me. UJpy is headed for a 15 year low. It will be interesting to see how price action behaves as we move closer in the near future.
Regards,
Muthu.
Chennai.
India.
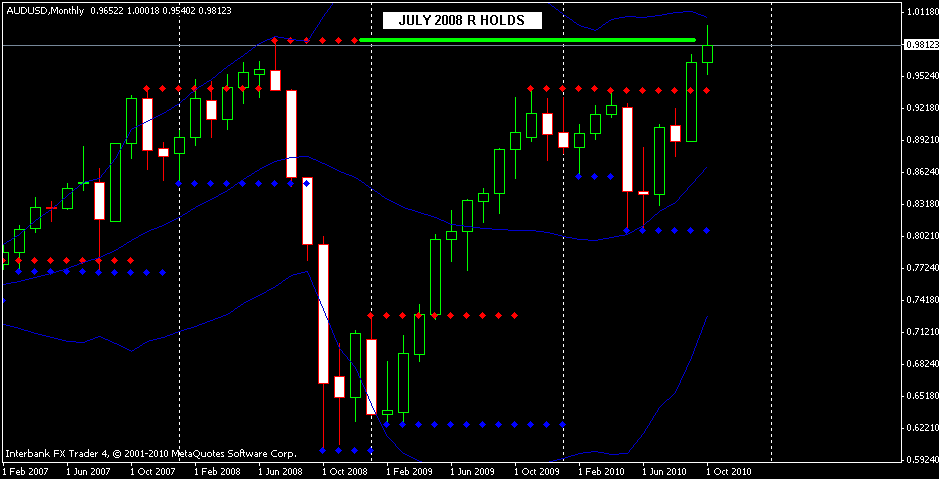
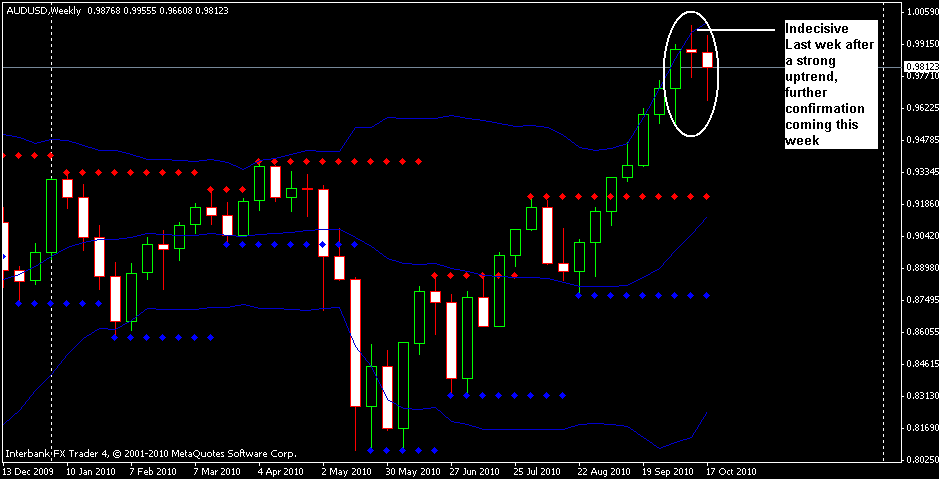
A look at the monthly and weekly Aus Usd chart.
Although price did break R in the M chart, it is unable to make a clean break above and is still indecisive as seen when we drill down further to the weekly chart. Lets wait for next week to see if this is really end of the trend or a fakey
Regards,
Muthu.
Chennai.
India.
Perhaps it’s time to breath life back into this thread. I do have a couple open positions, but in the interest of productive instruction, I’ll keep those to myself and post the next trade I enter into.
Time constraints with my current business only allow me to trade daily charts. I’ll post entries and exits with an explanation of why.
No indicators will be used. Pure price action. Naked Trading. 
TMI brutha… TMI.
Post the trades, yes. But we don’t need the visual:p

Good to see this one kicked up again!
Finally … i am pinning for new posts by MG… i love the way u trade
Hi Gunner, I would like to see this thread get active again, there is lots of good reading and examples to learn from here…
Okay, I haven’t been ignoring this. I simply haven’t able to post the trades near real time from when I’m entering and exiting. Largely due to the fact that I’ve pretty much replaced my laptop with an iPad and screenshots aren’t possible with my trading software. When I get back to my laptop I’ll post a trade I entered in today along with the reasons behind my decision. You’ll just have to take my word for it I suppose.

Finally.
Okay, typically I prefer to post this real time, but it just isn’t feasible for me right now. Perhaps if my schedule slows down, but for now, we’ll just have to take this for what it’s worth. To keep things fair, I won’t post another trade unless it’s a loser and then I will rotate back and forth. The lessons shouldn’t really change whether it’s a winner or loser.
As it stands, I’m currently in this trade and right now it’s the only trade I’m in. I’ve only been taking one position at a time for a few months now due to my schedule as previously mentioned.
So let’s take a look at this trade. This trade I entered without the use of any indicators. Not even as much as a trend line or any other price action tool. I simply looked at the candlesticks and let them tell me the story of what was going on.
Late April price spiked down and created a sizeable pin bar. Why it spiked, I don’t know. I leave that to the fundamental traders. I just see what price is doing and react to that. I viewed that areas as a line of support/resistance to look for areas of either a stop loss or take profit. Price in fact did go down and in the beginning of May, another pinbar showed up. This then created my overall range. I was looking to take a trade somewhere from the top of that first pin bar to the bottom of the latter pin bar.
It’s important to note, that I was not watching this particular pair this entire time. The analysis I just made mention of was done within fifteen minutes before I entered into the market.
Now look to about 7-8 bars ago. See how price reached a point and then retreated? It clearly didn’t like being by that price. The following bar clearly showed indecision in the market. Then the next bar, price shot up a bit. If you weren’t paying attention to the pin bar in late April, you might have taken this trade as a breakout of sorts. But if you held on for even a day, it would have bit ya good.
Let’s look now at even the following candle. Price made an attempt to drop, but it failed. There was a struggle in the market. Was price going to go up or was it going to go down. At this point, I would have had no clue, and I would not have made any attempt to guess.
Now here is why I made a short entry. Over the next following days, price tried to move up higher and failed, each time becomming an even shorter candle than the day before. I took this as an immiment sign of a break out. So when I saw that the candle broke the low of that small little indecisive candle, I took my entry into a short position. I didn’t have a solid stop loss, but knew that if price started to jump up I probably wouldn’t have exited unless it closed above the high of the previous two candles. My overall profit target is the low of that pinbar from early May. However, depending on how this week goes, I’ll probably pull out early.
Right now I’m 70 pips in floating profit.
Fire away if you have any questions. If not, I’ll see you back here when I post a losing trade.
Update: I moved in on the four hour chart and saw that price tried breaking the previous candle’s low, reversed, and spiked up something nasty. I closed the trade with a 30 pip gain.
Great to finally have you back MG!
