Price Action, Market Structure & Bollinger Band

Hi All,

I trust you are all well.

I have created a few topics on this forum (London Breakout 1H Strategy & What Timeframe Do You Trade) and a few people have asked for my daily trading routine/system, so I finally today have had the time to sit down and write it all out.

Now, this is probably going to be lengthy, so I do apologize for that, but I’d like to cover as much as I can and if you have any questions, feel free to shoot me a message or comment below and I’ll be more than happy to help where I can.

The Timeframe
Before I go into the strategy, let me put it out there that I trade the daily chart exclusively. I don’t even look at the 4H timeframe or anything lower than that. Sometimes I do it for the fun of it, but not for my serious trading. I have already written a length topic on this so please feel free to search that one up, but to recap, here are few main points as to why I do this:

  • More often than not, price actions are correct and market structures are respected compared to other lower timeframes (the lower you go, the more noise there will be)
  • You don’t have to spend hours on end in front of the computer each day waiting and waiting and waiting for trades opportunities just to lose or miss it which leads to frustration
  • You only need to check the charts daily before the daily candle closes (about 20-30 minutes before), maintain your existing trade and/or enter new trades and go about your day
  • Teaches you patience (very important in trading)
  • News no longer affect your trades as much
  • Bigger profits potential (bo looking at the bigger picture)
  • Less stress = clearer mind = better trading decision
  • More freedom to do whatever I want

The Strategy
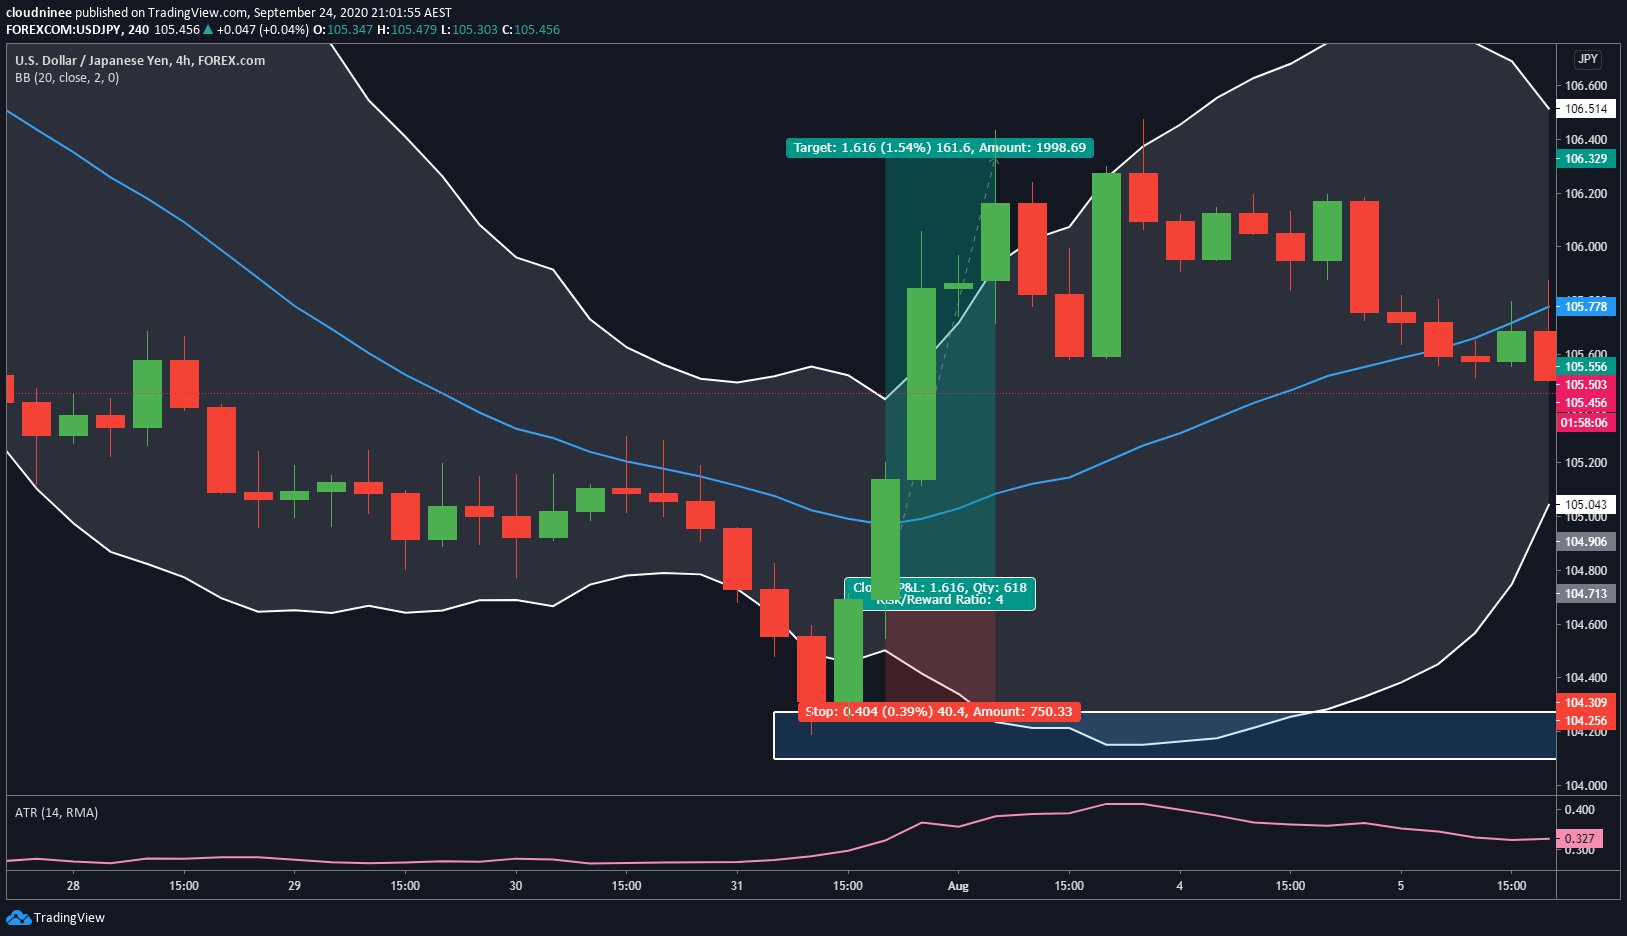
It’s very simple, the way I trade is I look for market structures, price action in combination with the only indicator that I use which are the bollinger bands. These are more than enough to give me powerful signals that will give me a very good idea of where the market will be going the following day. Check out the image below and see for yourself.

You may wonder, if I trade the daily chart, does that mean I am swing trading or position trading and that my trades can last for days, weeks, or months? Yes, when I see the opportunity to do so but not necessarily all the time, in fact, 70-80% of the time, I am still a day trader.

For every trade that I open, I open 2 positions, 1 for 80% of the full lot size and the other for 20%. The 80% position is my 1:1 RR and the 20% position I call it a “runner” - meaning I will maintain and let it run for as long as the trend can go for maximum profits. I move the SL of my “runner” to breakeven once I have achieved my 1:1 RR with the 80% position.

It would also be helpful for you to learn the basics of the following first:

  • Candlesticks (anatomy, various patterns such as double top/bottom and especially focus on signs of reversal, continuation, and consolidation)
  • Bollinger bands (how to trade trend, reversal, and squeeze with it)
  • Market structures (how to identify key levels)

You want proof that even though I trade the daily timeframe, my trades only last for within 24-48 hours? Here:

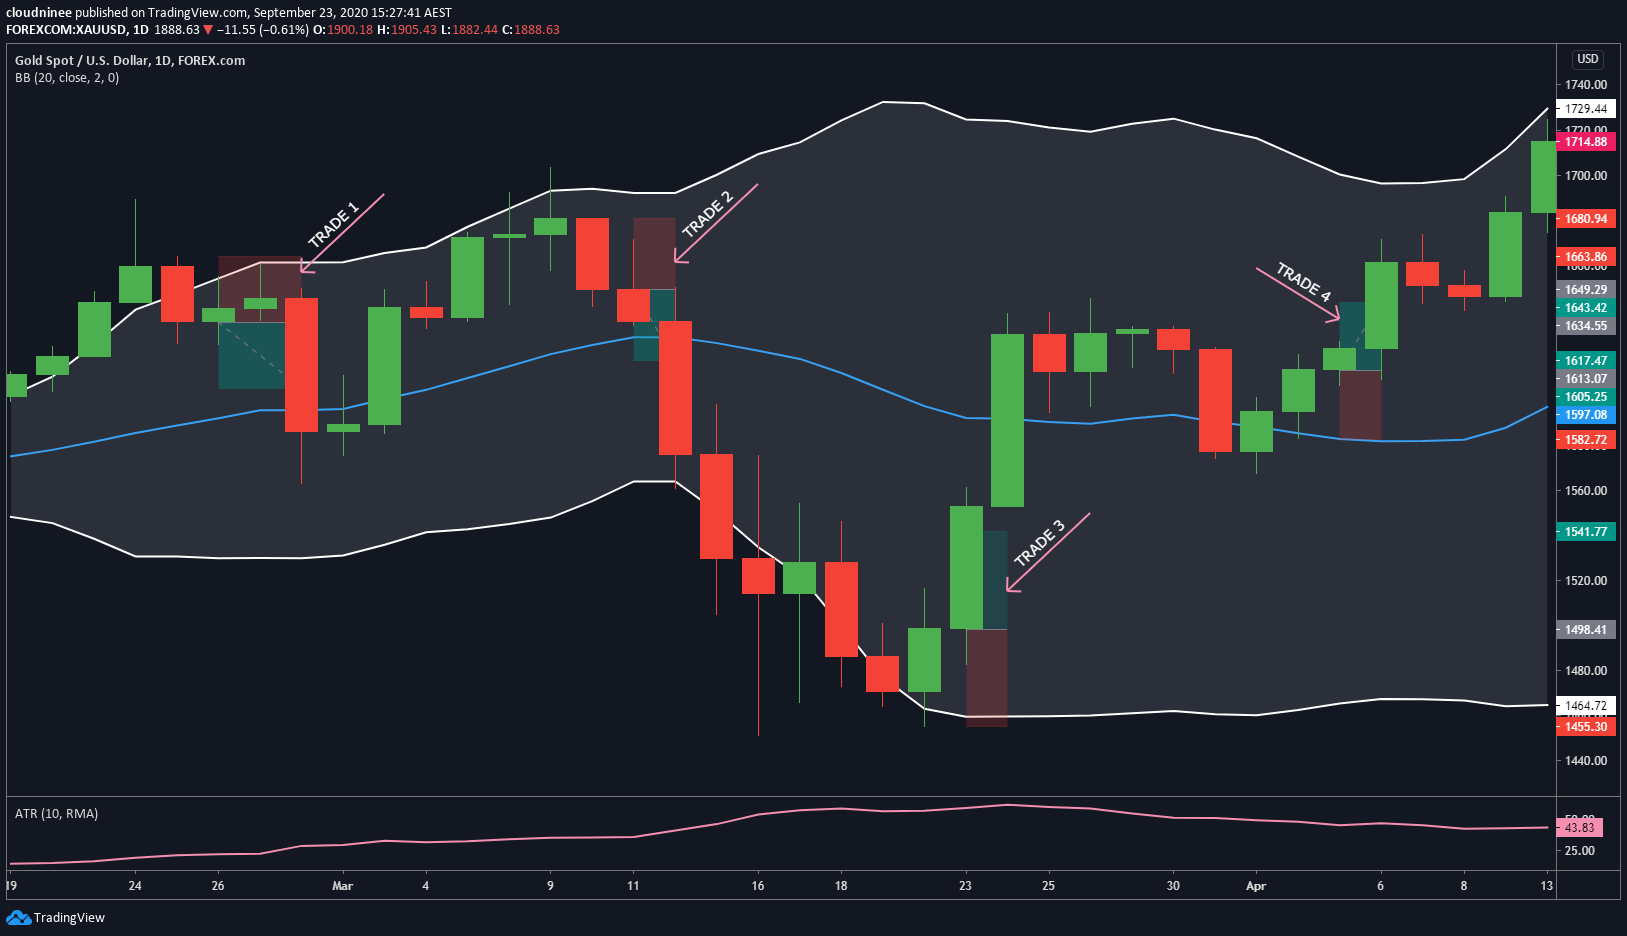
Trade 1 - Price broke out of the top of the bollinger band and showing signs of weakness (long upper wick). The next candle is a strong bearish engulfing candle. I entered short and got my 1:1 RR day after next.

Trade 2 - Price went up and tested the top of the bollinger band again. When it does, the market shows indecision. When the bearish engulfing candle show itself again, I entered short the next day and got my 1:1 RR the following day.

Trade 3 - Price tested and broke out of the lower bollinger band and a bullish engulfing candle appeared. I entered long the next day and got my 1:1 RR the same day.

Trade 4 - After the price has broken through the middle of the bollinger band, it came back down to retest it and failed to go further down. Once I have confirmation of the continuation up (after 2 continuous strong bullish candles with lower wicks rejecting the bears), I entered long and got my 1:1 RR the next day.

Now for the above trades, I did not talk about my “runners” as these are quite subjective and it’s up to the trader him/herself to decide how to move the SL up to secure profits on the go. But the point is, and you can also tell based on the photo for this one currency pair during the period, all the trades I took can certainly come out with profits with minimal to almost no loss.

Currency Pairs
As I trade the daily chart, I cannot just watch one single currency pair as otherwise, I’d have to wait for a long time for a trade opportunity. I trade 23 currency pairs and gold. If you’d like to know what they are, shoot me a message. Listing it here would make it too long.

If anyone tells you that you should only focus on certain pairs only, I call that b*llshit. Yes, certain currency pairs move differently compare to others however, price action and market structures don’t change, they are exactly the same on any currency pairs.

It could be true, that you should only focus on certain currency pairs only, but that’s if you trade the much lower timeframe. But if you let it sink it, this is just circumstantial, you trade the lower timeframe, you don’t have the attention span to use it across different pairs. I trade the daily timeframe, I have plenty of time and more pairs = more trading opportunities.

Disclaimer
There is no holy grail of trading strategies out there. I am a firm believer that the best strategy is one that you find suits you the most both in your trading style as well as your lifestyle.

If you like the strategy that I have presented here, please feel free to backtest it, anyone can do it, you just need to learn the basics, add the bollinger bands indicator on to your chart, scroll back in time, and check it out. Don’t put your real hard-earned money on the line until you are 100% sure and are confident you can come out profitable. Feel free to add other indicators if you want and twitch the strategy as you please.

I did not make this strategy and I am not laying claim to it. I learned to trade on price action and I found tutorials on bollinger bands and I decided to put them together. I am sure there are many others out there who already are doing the same.

There are many different ways you can trade this to come out profitable. If you come through any situations where you are unsure, feel free to ask me and I’d be more than happy to provide my insight/opinion.

31 Likes

Hi @Cloudninee

Nice post. Do you have any track record of your system?

You are so true when you write “Teaches you patience (very important in trading)”

If you can send me the list of the pair you run would be nice.

//H

4 Likes

Thank you, CloudNinee. will go through it today. If you can share some test results or diagrams etc. please it will help newbies like me.

1 Like

I will send it to you via direct message.

I don’t have any track record like myfxbook etc. The ways I trade are usually simple enough that people can easily backtest and in fact, I encourage people to backtest first so they can get comfortable with the strategy rather than looking at numbers and then beleiving it and putting their money in.

Also I have nothing to proof, not selling a course or anything. Just here to share my knowledge and people can take it or leave it :slight_smile:

2 Likes

Feel free to have a read though and let me know if you have any specific questions. Then I can provide diagram/trade setups accordingly to help you understand better.

1 Like

Same for me. Just here share my knowledge. I will check more in details. ( Thx for PM )
I will check some SL I would like to have

//H

1 Like

If you are following this strategy, often I like to only have minimum SL to ensure nice RR ratio. Usually at the open price or at the highest/lowest price of the previous candle depending on the situation. Doing some backtesting will help gaining experience with this.

1 Like

looking forward to backtesting this, would also be interested in the pairs you trade. Many thanks in advance

1 Like

hello Cloudninee, what are the parameters for your Bollinger band?

1 Like

I have messaged you the pairs that I trade. Feel free to test it all out for yourself and see if it works for you :slight_smile:

The bollinger bands is just of the standard setting - 20,2,0.

1 Like

Hello Cloudninee,
Do you have a high win rate with this method because of looking for the 1;1 rr for the 80%? Or do you get enough runs with the further 20% to make up for losses?
Cheers John

1 Like

Hi, thanks for sharing your strategy! I wonder what does other pairs are but somehow I can’t sent you a message. Is this because I have just registered here?

1 Like

Hey John,

As you can see in my chart examples, my SL is very tight so the 1:1 RR is very achievable again and again. Once my 1:1 is achieved, my 20% runner will have a BE SL and I let it ride. As I trade with the market’s momentum on the daily chart, most of the time if my analysis is correct and if I only trade strong signals, the market will move in my direction for at least the following day. That’s the key though, only trade strong signals and you will come out on top.

The 20% trade plays a big part too when there is a strong trend, as you can really ride a trend out. Check out gold on its recent ride up, my trade stayed open for that for nearly a month (June to July) :laughing:

When there is a very strong signal, I can go for more than 1:1 RR. I have attached one of the examples below. This trade could have easily been a 4:1 or 3:1 depending on how you manage your trade, very subjective as each trader is different - a beginner would get very twitchy and move his/her SL every hour while an experienced trader would be more patient and only move SL up tight at signs of reversal or consolidation. The signal is very strong - multiple signs of exhaustion in the bears market, break out of the low of the bollinger bands, bullish engulfing with little wicks to the upside, etc.

What you can also do is move your SL up on the way on a strong trend like this and one tip I can give with that, and you only need to do it if you have time, is use the 4H timeframe. Then you can move your SL up to the most recent swing high/low.

Hope this helps and anything else, just let me know :smiley:

3 Likes

Hey I have sent you a message :smiley:

1 Like

I got something interesting @ D1 NZD/JPY (NZD/USD looks almost the same)

Still some hours until the candle closes, but imagine that this white candle would be a little bit longer at the end of the Day, would you call this a good opportunity?

If the Candle would close like this, would you call the wick to long?

1 Like

Good spotting, this is a mixed situation and I’ll tell you why below.

It does look like a good opportunity for a few reasons:

  • Price has bounced off the most recent support (look left) and it appears that same place has been resistance before as well
  • A doji candle has formed the previous day and today’s candle has been bullish

HOWEVER, I would also be very cautious about taking a trade here because:

  • The overall recent trend is down, and it has been very bearish for 2+ weeks with many signs of rejection for the bulls, or in another word, the bears have been in control for quite a while with the bulls having little place in the market
  • This is only the first sign of reversal and the signal candle (current candle) is not as bullish as I’d personally want it to be to take the trade (long upper wick of the current candle showing bearish power)

If you want to take this trade, my advice to you would be to:

  • Place a BUY STOP at the high of the signal candle to ensure the market will go in your direction to take your position with momentum
  • Monitor your trade closely (maybe use the 4H or 1H timeframe to move your SL as you go to secure profits on the go as it can easily turn around and keep going with the trend at any time
  • Only aim at maximum for price to reach back at the middle of the bollinger bands (price won’t go to the other end unless the trend has changed
5 Likes

Placing a buy stop sounds like a good idea in situation like that, because as you said, the current candle is not a bullish as it should be.

I was also considering this candle for not bullish enough, but I didn’t think about the buy stop.

Right now the candle looks even less bullish, looks like it is forming a hammer, which could also be a signal for a trend reversal but further confirmation is required.

Thanks for your advice!

1 Like

Thanks for your answer and input, watching with interest.
Cheers

A hammer candle following a doji shows market indecision. When there are these signals you need another candle to confirm the direction. Long wicks indicate the power of the opposite side stepping in so to be cautious :smiley:

You can clearly see though how the daily candle/chart can really help you put things into perspective because it takes 24 hours to form. The one candle alone contains a hell lot of information that can help you make decisions with ample time. If you look at a doji candle on the daily chart comparing to the 1m chart, which do you think would be more helpful and trustworthy? Which would give you a better picture? And most improtant of all, which would give you more TIME to decide on a trade?

2 Likes