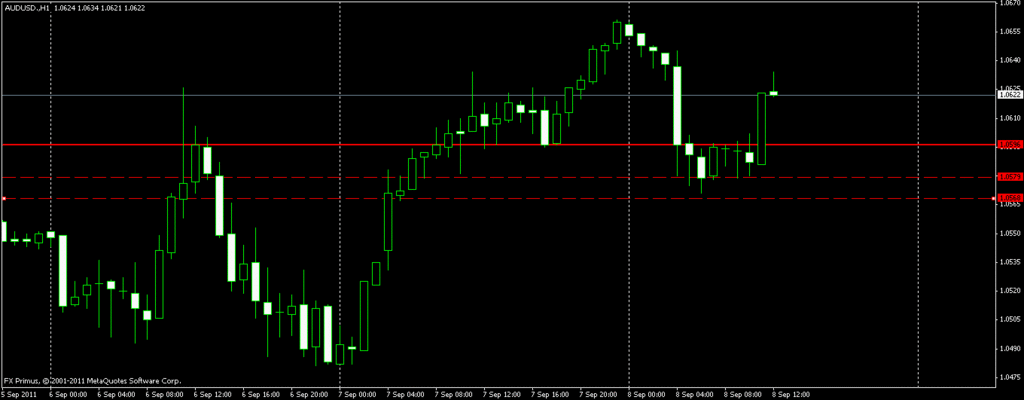
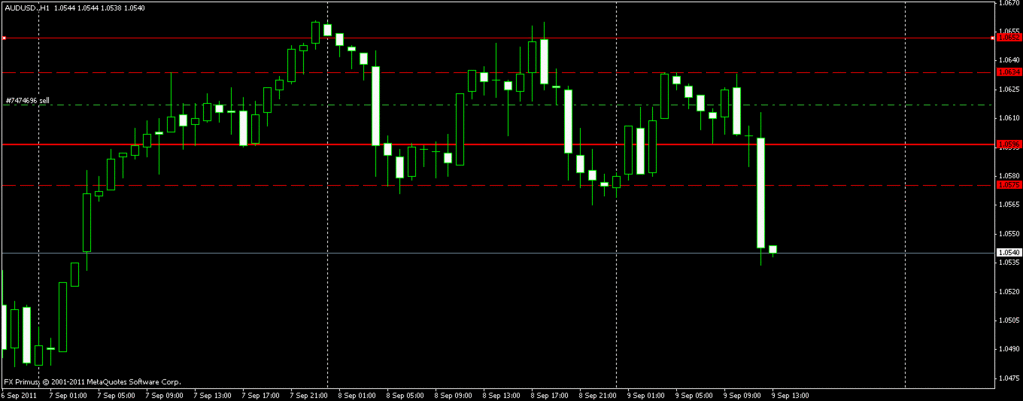
Interesting way to do trades.
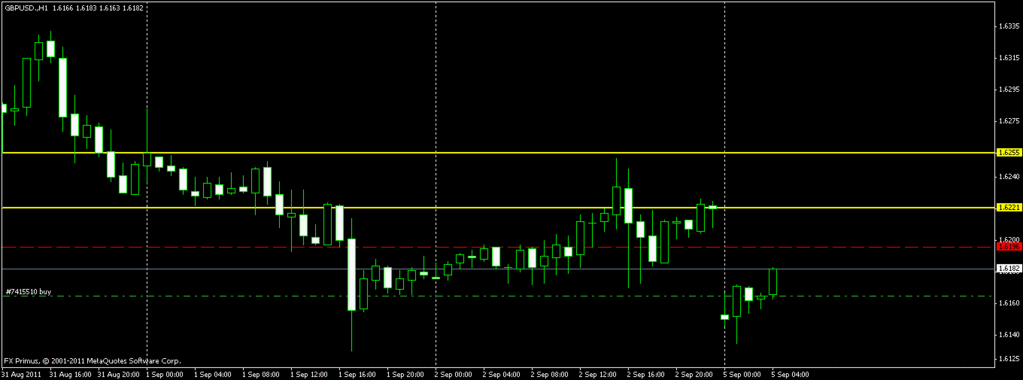
GU H1.
Not trading the communist system as I dont know what is the bias or anything like that.
GU sell for NFP was concluded with a healthy profit.
Just scalping based on S & R levels alone.
Again entry is very very late. Not good for holding.
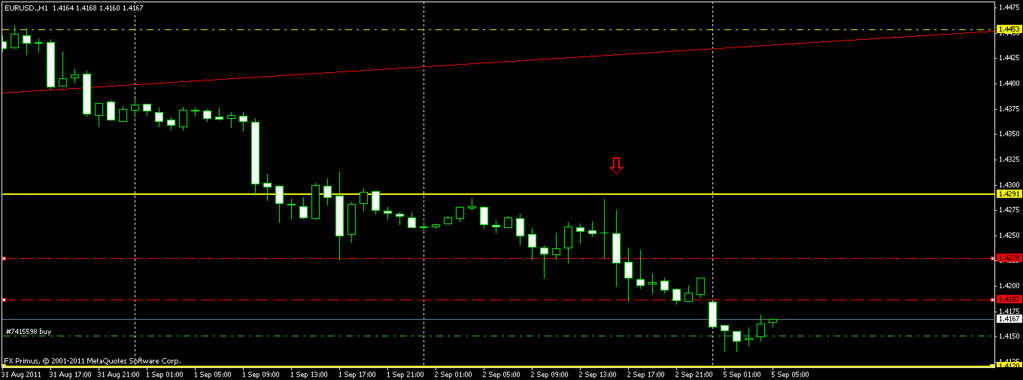
EU H1 TF
Again if we observe there is a yellow line marking previous bounce areas or support areas at the bottom of the chart.
I am breaking many of my own rules here so dont take this as a method of the system advocated here.
Its just another quick scalp.
Some of the big rules that I am breaking.
-
Entering without knowing what is the current bias.
-
Entering on both GU and EU at the same time. Correlation is dangerous. When one goes against, the other will most probably go against us also.
Red line is marking possible Resistance areas.
Quick Scalp of 10 to 15 pips, or move SL to BE and play the luck card, or just cut positions and take the net 30 on the table right now.
Decisions decisions.
Finally a note of caution to those who have been following the communist method and trying to trade with this system.
Do not throw out all that you been using as guidelines prior to post 357. Its something that is inherent to all those who are just learning how to trade forex to do that. We see something new and we conveniently forget what we have been trying before.
Its just the nature of technical charts and how we look at it that makes us unconsciously behave that way. Couple in the factor of money being involved and that flaw is strengthened even more.
Very few among us can be balanced and take the good and bad lessons and observations of prior experiences and trials, and apply it to the current issue or method we are looking at.
Me included. I didnt learn how to trade profitably until I realised that I been throwing the baby with the bathwater many times previously.
Continuum is often jagged in the process of learning how to trade with technical charts.
All we been doing until post 357 is the structure for reasoning on taking a trade. Its important.
We cant simply just look at S&R levels and trade it without a proper entry rule, candle patterns etc etc.
The last part is just to add to the way to see where to look for signals and which ones to ignore.
Happy Pipping.
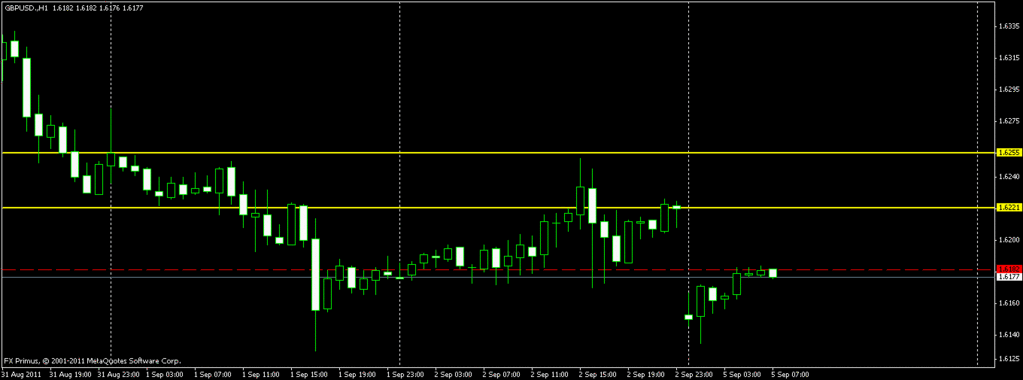
GU H1 TF.
Ok before we go on please note that I have taken whats on the table and I have moved the red line as a marker for my previous support area. ( post 362 shows where I put that red line previously )
As we can all see price has been stagnant at that line for the past two hours and it cannot break upwards.
Now this is a classic price action play at the moment.
The market will always behave in certain ways when it comes to areas that had previous levels of S&R.
Some call it price memories.
EU and GU show the same patterns and behaviors at this hour on their respective levels.
So am I going to sell now?
I am tempted to enter with a very small lot. Maybe 10% of what I normally would risk.
Why so small or not at all??
Because from experience I know this is not the best time to trade.
I will wait for UK market to come in. So I decide to skip this entry.
Secondly, what is my bias? Weekly continuation of bias happens when the market is trending strongly. At the moment it has yet to do so.
The point of this post is to highlight how price moves. Price action is about price behaving in certain ways at certain levels. Most of us who started out initially thought that market did something randomly or we go on looking for a reason why this or that happened after the fact that it had happened.
Often we nearly gave up thinking that its too complex and too many variables are involved etc etc. We all thought that the market movements were arbitrary.
Market is not arbitrary. It does not do what it fancies. ( atleast most of the time.  ). And finally randomness, luck and a gamble has nothing to do with profiting from the market.
Happy Pipping
( p/s. Was a good call in taking what was on the table in regards the buy. Bad call not selling at that bounce. )
thanks for the great info!!

Hi Nikita,
I took this trade and lost. Please comment and critique what I did wrong here.
Yesterday was a Sell on GU, EU, AU
Shorted AU at: 1.0600
SL on previous high: 1.0633
What do you think of candles in grey box, can we say there is sign of reversal ?
Thank you for the help
Uploaded with ImageShack.us
yo fx280,
any pic of the Day chart?
AU H1 TF
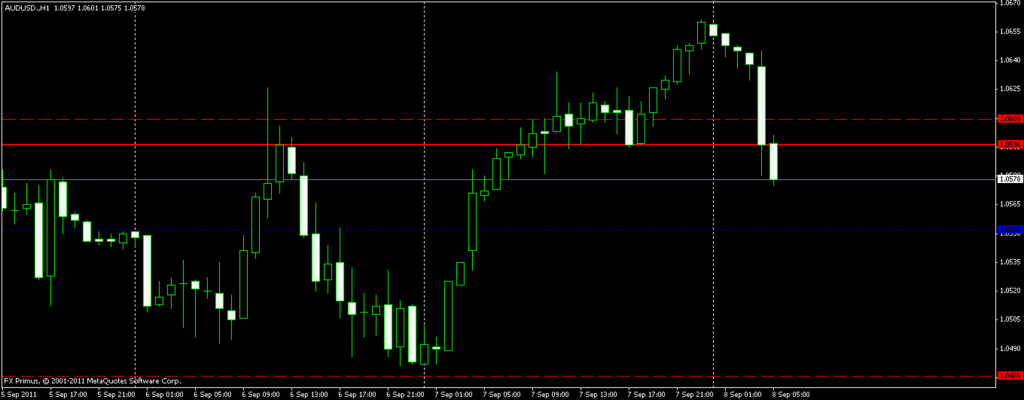
The thick continuous red line at the bottom is where price bounced before this. Clear bounce. Price broke through that level, so resistance is broken, then shoots up and pulls back to test that line again as support. Bounces that line again and shoots right up.
In between of looking at GU, EU, AU and Kiwi yesterday I decided to sell EU because of how the charts look like. EU had the strongest pull back of all 4, Kiwi had none at all.
I took 43 pips on EU sell.
The reason why I skipped AU is because where the price reversal took place. It was higher then yesterdays high. So to me that signals that something is wrong. Its suppose to go by wave remember?? This wave broke the continuation of that wave pattern. So I skipped.
The red dotted line is where you should have ideally sold. You got more than 4 opportunities to get out of the trade at BE in 7 hours.
That is as safe as its going to get.
I bought Kiwi later in the evening for US session. Didnt get as much as AU gave but still 40 pips is good enough.
Kiwi H1 TF
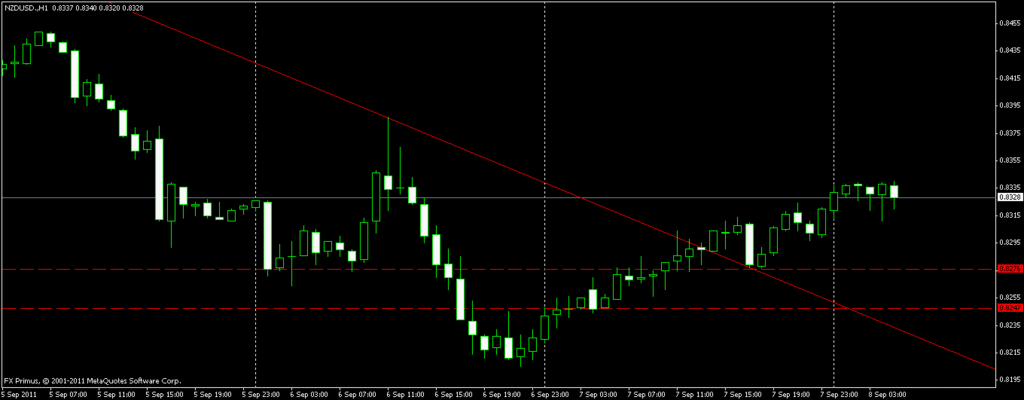
I dont use trendlines often, but this is the reason why I choose to buy Kiwi of all the other pairs yesterday evening.
Please note the two lines are markers of previous support and resistance areas.
Price broke the down trendline, did a picture perfect pullback to the resistance which was broken and on retesting has become support.
In with big lots, SL about 15 pips.
As it happened, AU gave more, but then its reasons for me to buy were not as good as Kiwi. We take whats the most ideal setups.
If you are not sure, then skip it.
Ours is not a trading system per see. Its reading price. So in order for it to be very profitable, we must be ale to make discretionary decisions which will maximize our returns.
Complete step to step of taking a trade.
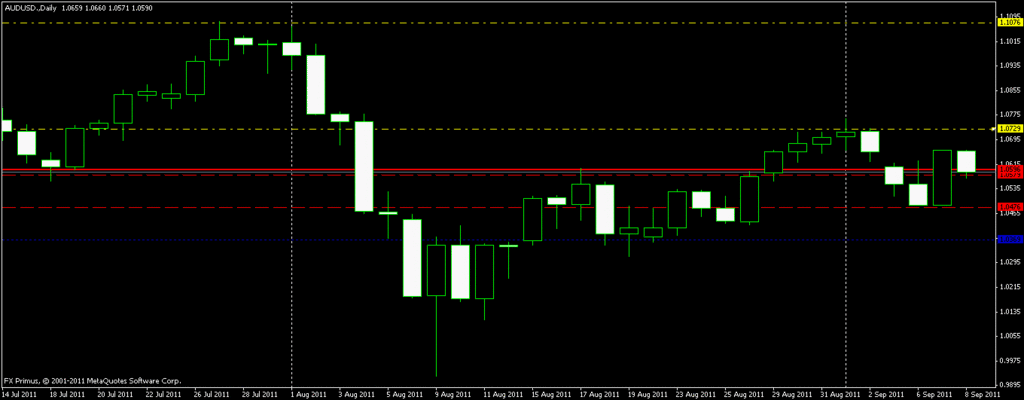
AU D TF.
So bias is a buy.
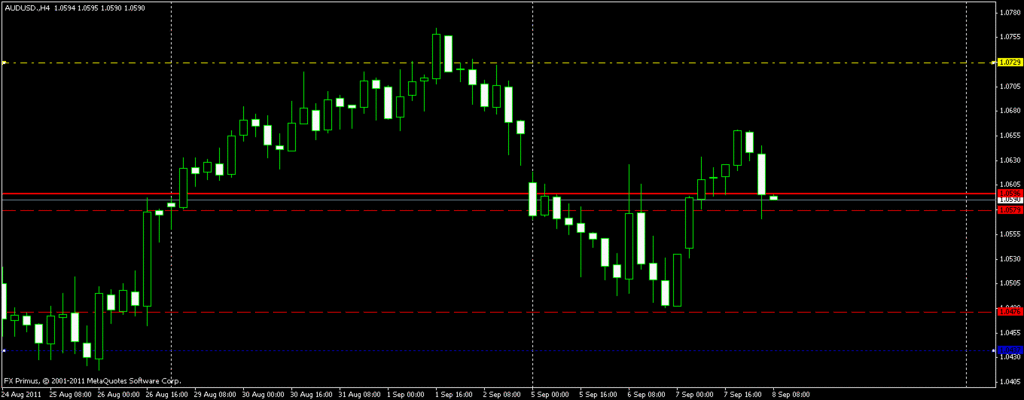
AU H4 TF
We look for some immediate bounce areas. Support and Resistance if you may. Mark those areas with some lines.
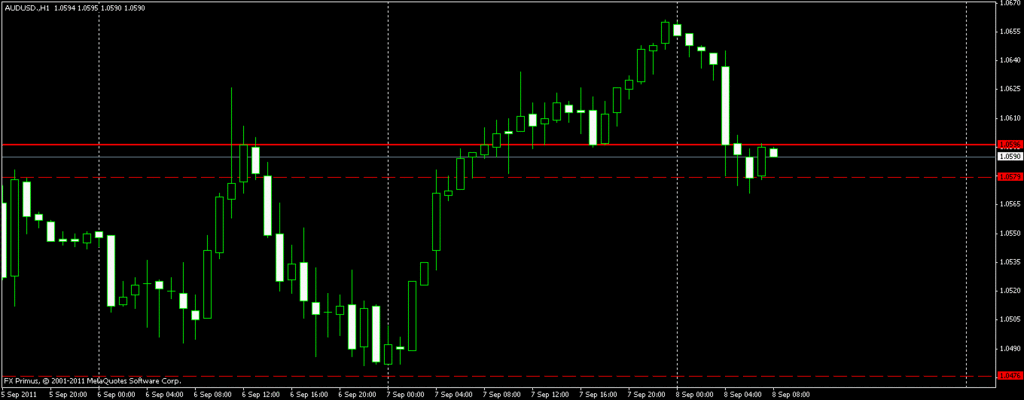
AU H1 TF
Once we have established our Support / Resistance on a higher TF, we just zoom in to a smaller TF.
In my case I prefer H1 cause that is as low noise as you are going to get.
When you have it right, you will see something like what is happening here.
The continuous line above is the resistance area, the thin one below that line is support. Now our bias is buy. So we should try to buy as close as we can to the bottom line to minimize loss and also the trauma of holding.
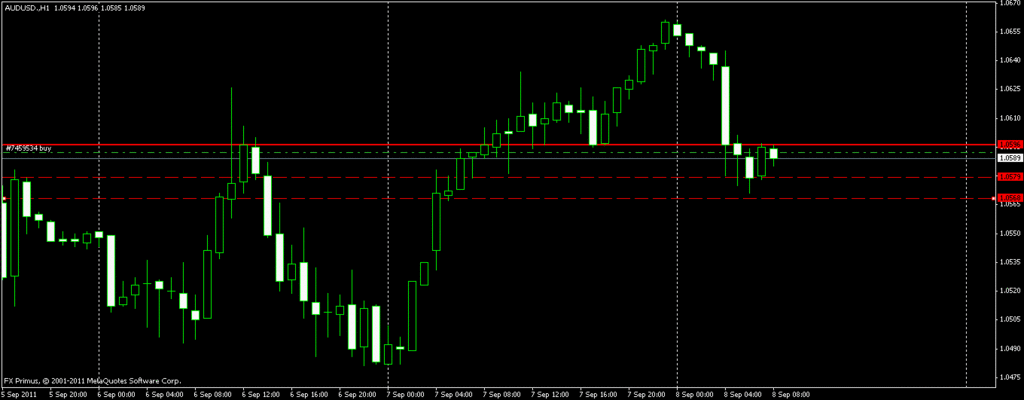
AU H1 TF
Not one of my better attempts to buy as low as possible.
I should probably start putting in pending orders. That way precision would be improved.
The third dotted line below is the area where I would probably think of cutting the trade off if it goes against me.
Happy Pipping.
AU H1 TF
A properly drawn S&R line would hold beautifully like this one. Too bad my price was not the best. Once spread was added it fell all the way at the top.
So there you go…a step by step of what I do to trigger a trade. Had another one going in EA also…same classic play with bias. Total haul for today is 80 pips.
Am going to take it easy until I see something on the US session. Plenty of news today so becareful.
I have to include a note.
Trading price action is not trading a system.
You either know where price is going and take advantage of it or you dont enter when you dont know what the hell its going to do.
You would probably risk much more then trading a system and your account is either growing week to week, month to month, save for the occasional emotional blunder or you have to go back to demoing.
If you are still guessing then you have to spend more time on a demo. My take would be minimum of 5 profitable trades on different days before you can say that you are fairly down pat with what is happening.
There is no two ways about it.
Trading PA is not the same as trading a system.
A system is where we take a trade when the system shows a buy or a sell.
A good system is profitable only after it has been back tested and statistics prove that it can be profitable in the long run. You then couple that with sound but conservative money management and you are ready to slowly compound your earnings.
Both are different ways to play the market. The methods are different and the money management is different.
Nikitafx, thank you for this thread. I’m a new trader and after some study of different approaches trading PA is the route I am focusing. Between learning from yourself and efxpa I’m really excited about my trading future.
What is your method for determining market bias?
Look at the beginning 5 pages ddrankin, that should give you and idea of bias and what to watch out for.
Look at higher TFs, especially at the reversal areas.
AU H1 TF.
Same methods. Draw the lines and look at where its going to go. Try to get the best price inside the range area and hold till it hits the next level.
Had a loosing trade in EU yesterday evening due to greed.
So had to cover back today.
Have fun.
whaw many lessons have been added. gonna be a busy night tonight preparing for tomorrow 
You either know where price is going and take advantage of it or you dont enter when you dont know what the hell its going to do.
btw i’m reading the nisson’s books on candle charting. it really does help a lot to understand the logic behind each candle pattern. and actually there are indeed many opportunities behind the candles.
all this time i’ve been trading with only hammer and shooting star. until now i found these two signals are the easiest and valid. combined with early lessons from the thread i have found a quite firm ground in my trading.
speaking of support and resistance… first trade after holiday. was really nervous.

closing

this is the daily

Welcome to the club Villain.
Watching price do the same thing again and again.
You might want to also start observing S&R on H1 for TP levels also.
Try to observe how S becomes R and vice versa
