Pure Price Action For Dummies

1.4490.

Would have been taken out with a loss of about 10 or 11 pips.

Your SL is valid, no doubt. If we look at waves that is also a valid SL.

but its just that I personally would not have risked that much since the market is so whipsawing and to collect 40 or 60 pips per trade is hard at the moment.

Just a personal choice.

As we are seeing now, the strategy is not doing very well because most of the time the market is bouncing of the daily high and low.

Where it usually would have been a continuation there seems to be a reversal.

unless we risked very small lots and took a sell buy sell buy sell buy option, our pip collection would be poor.

i personally only collected about 60 pips last week. The entire collection of a single trade was done in one week.

So bear in mind the markets are having a fever at the moment.

Its interesting to note how AU and NZDUSD have a high correlation rate but GU and EU dont seem to.

Its also interesting to see, as per charts how EU GU dont pair with AU.

Commodity pairs usually act similarly. I dont feel comfortable trading something that will not stop climbingā€¦

Or couldnt stop falling like in the case of UCHF.

And most yen pairs. Somewhat of a correction currently but Ill stick to my Majors hahaha. Its Amazing how many pips even EU will yield in a trading session.

My findings; On a Daily TF Correlation:

USD/JPY - EUR/JPY : 90.7
EUR/JPY - USD/CHF : 81.1
USD/CHF - USD/JPY : 78.2 On a weekly trading frame, however, the UCHF/UJ is the only
one holding up. What is more important for bias correlation? Weekly or Daily
TF?

On the Weekly however, the 3 highest are as follows:

GBP/USD - EUR/USD : 86.3
AUD/USD - NZD/USD : 82.2
AUD/USD - EUR/USD : 79.9

So which is more important? and also, how about negative correlations, can one trade their bias

Entering on a tight SL we can forget about weekly.

The SL can be as high as 2 or 300 pips.

Right now at the moment daily correlation is between GU EU and AU NZDUSD.

Those who had sold GU or EU after seeing the previous day candle of EU and the big pullback on GU on monday would have done ok.

Those who had bought AU or NZDUSD after it bounced off the wave when they were done selling EU would have done better.

I have left out Yen pairs at the moment because it takes alot of faith to enter them .

EU D TF.

Something will happen soon.

Lets hope we will be able to capitalize on it and make for the short falls of the previous weeks.

Ok, but I mean, which is better correlation to go by? Weekly or daily? are you saying that weekly correlation doesnā€™t matter? I thought it would show that, despite these weird FX times, the ones continuing weekly correlation means they are correlating on a larger scale? And how does JPY require faith, when the correlation withstands? Thanks!

Also, how about trading negative correlations?

Weekly correlations are fineā€¦but what about our entry??

Can we look for tight stops?? Or should we hold thinking that it will go one way or the other because of Weekly correlation??

One should not forget that for those who hold trades for months and use weekly for entries most probably are trading lower TFs as well because its all ranging.

What is our TP like??

I tend to cut off anything that is above 40 pips if I dont see it going somewhere or when I am risking 10 or 20% on the trade.

Do we hold for 200 or more pips to justify the weekly TF??

Its not prudent to enter with weekly or use it as a guidance to hold or cut when we are targeting 40 to 100 pips.

The SL can end up being disastrous.

Well as for yen pairs, unless there is a momentum for a upmove, the market is going to be super rangy as it is now. Look at D TF. It has hit the bottom and it just cant seem to break upwards.

Its difficult to do the sort of analysis that we enter with when the market is the way it is.

UCHF was in the same scenario. Now its bouncing upwards. That allows us to trade it again. No doubt there will be those who take a plunge believing it will hit certain levels. But unless I can see previous resistance and support waves, it makes it a judgement call for me and I try to avoid these.

Negative correlation just means that currencies move the opposite. UCHF use to be a negative correlation to USD pairs. If you bought USD pairs then it meant you sold UCHF.

At the moment with UCHF shooting up, USD pairs should be shooting down.

Ok, thanks for your help. I mean to look at weekly TF correlation as a sign of correlation, not use it to trade with. But I guess, since we DO use the daily TF, that would be the best correlation to look at.
As for negative, we could use it too I suppose, but Daily TF.
Thanks!

Pay attentions to the wave Kummi90.

Pay close attention to price waves and previous HH or LL areas.

Hi Nikita,

Nice to see you over on Lumiā€™s thread.

Howā€™s things going for you this week, I see itā€™s a bit quiet without Villain, I suppose the weekā€™s trading has been a bit lacking this week. I know Iā€™m finding it a bit strange.

Iā€™m using Lumiā€™s de ja vu method at moment but finding my judgement on waves sometimes wrong. Tuesday up 60 pips, Wednesday down 50 pips. Yesterday broke even, today up 10 pips.

I liked Villainā€™s letter to you, I thought it was very good, Iā€™m missing his posts, I found them quite amusing.

Regards

John

Well Lumi is the one who thought me how to trade. I must admit that I still trade with some of his methods, and I do apply his teachings in alot of my chart analysis. He is big on Bear Gryls take on things, use all that you have to survive and thrive.

With that being said, depending on one system to make profit is not a good idea. As you would be forced to look for trades and when doing so we sometimes push things to the extent where we make fundamental mistakes. All the time.

Master one before moving to the other though. Dont add more to our plates. It does not help.

Finally as per my Post 349, EU had broken that pattern and its now sailing south. Good pip load in the last two days. Shorted GU also for all that it was worth and now am keenly watching Kiwi and AU.

I had also hinted on Eur Aussie EA, some time back in one of my charts, when we saw the big wick on the Weekly chart. That has been a real good pip provider in these lean times. Although the spread is high, the price movement is very smooth and consistent. For those who had been following, the communist system would have given them a good pip haul.

Lesson of the day. Dont break the rules but be flexible. Dont be too fixed in our ways and say ā€œI only trade the majorsā€ or something along that line.

Its a Friday so I wont pile up too much on the risk factor or lot size.

I think Villain should be back in a week or two.

Happy trading to all.

Oh and on your comment that trading has been slow this week.

matter of fact this week has been much better compared to the previous weeks where all it has been doing was whip lashing.

The final installment on the system.

THE BLUE PILL OR THE RED PILL ?

Its all in the waves. Every type of entry and exits are based on waves.

No matter what System you trade or what TF you trade, its all in the waves. Learn how to read waves and you will rarely loose to the market.

Learn how to read waves and you can look at any system and understand how to use it.

Learn how to read waves and you will know which trades to take and which to let go.

GU D TF

GU H4 TF

GU H1 TF

Please pay attention to the yellow line. That is all there is to it.

Many would have read at some point somewhere that when resistance is broken it becomes support. Support is broken it becomes resistance.

But what does that really mean and how does it affect our entry and exits??

Why does price falls to a level and then bounces??

Why does it retrace to where it does before it bounces off that level and continue falling??

Why does some retracements go up by a 100 pips and some barely more than 20 or 30 pips?

Why to that level??

Why not any other level??

Why we pick certain pullbacks to enter with bias and not the other??

Why oh why?

For those who have been following. This is the last missing part of the puzzle.

GU H1.

Always wait for the H1 candle to be over.

In the example above it went above the first line, hit yesterdays resistance on the second upper yellow line and down it goes.

Also observe how support on Wednesday was broken and became Thursdays Resistance.

Same level became Fridays NFP resistance level.

Entry on the above was too early. Could have made SL lower then 10 pips. SL at the moment is about 17.

News, no news, it always goes by waves.

NFP trade for this month is done.

Hi Nikita,
Thanks for the post. Few questions if you can answer.

  1. when you say learn to read waves, any suggestion how one should start?
  2. Should I open a chart and mark HH, LH, LL, HL? Is this consider waves?
  3. I guess waves happen on any time frame. For example Daily, H4, H1, M15?
  4. Do you have any preference which time frame you use to mark waves or monitor?

Regards,

FX280, these are the answers to the best I can.

Describing what one sees on the chart is not as straight forward and easy as it is suppose to be.

Looking and seeing are very different things.

SO with that being said lets look at your questions.

  1. when you say learn to read waves, any suggestion how one should start?

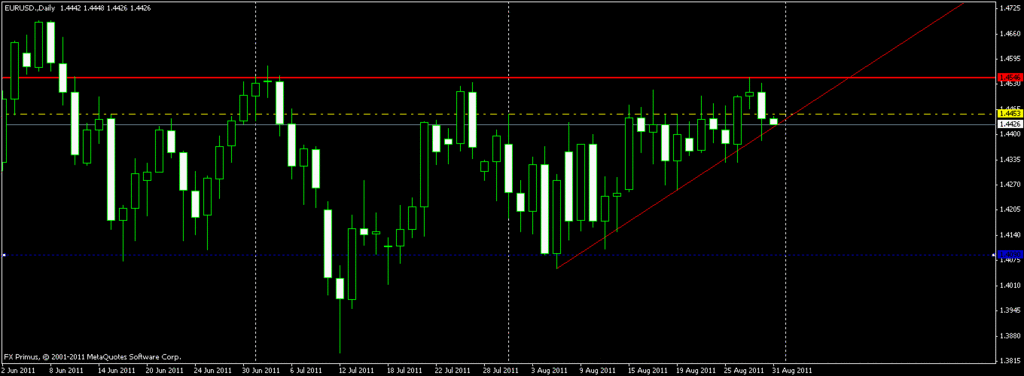
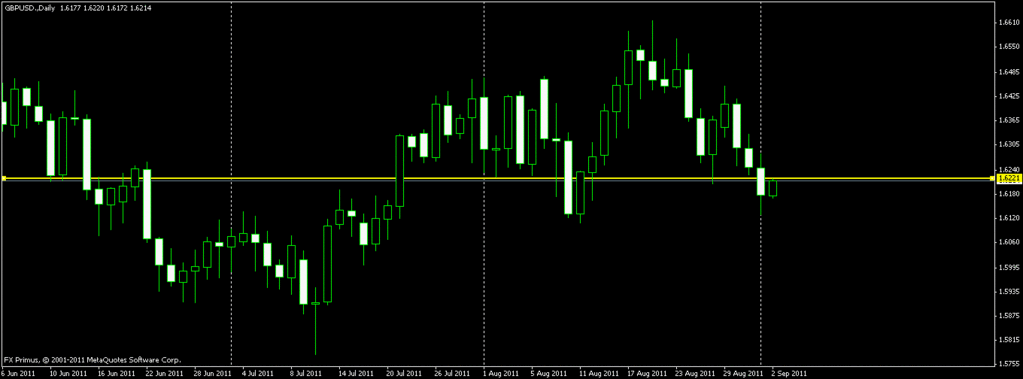
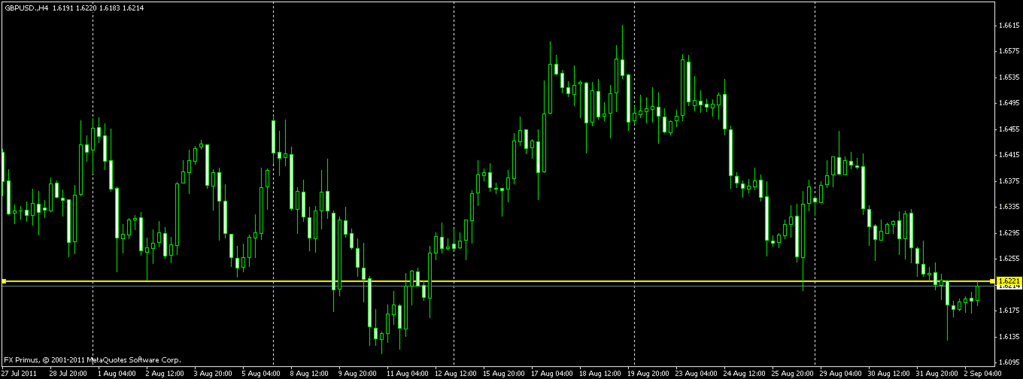
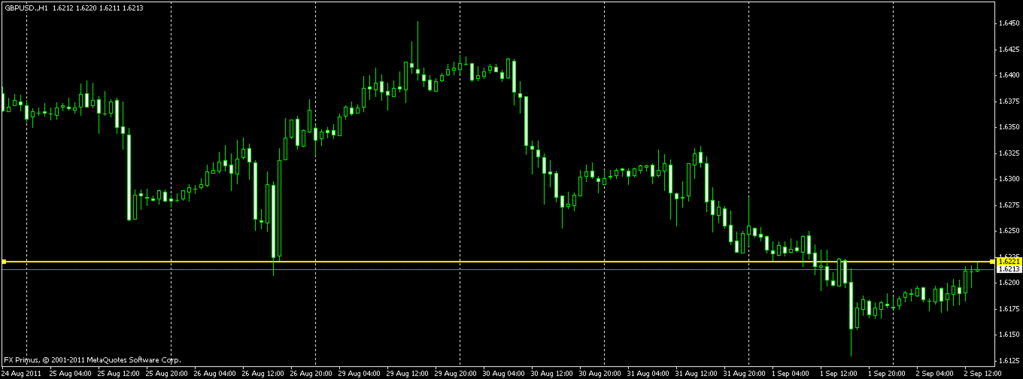
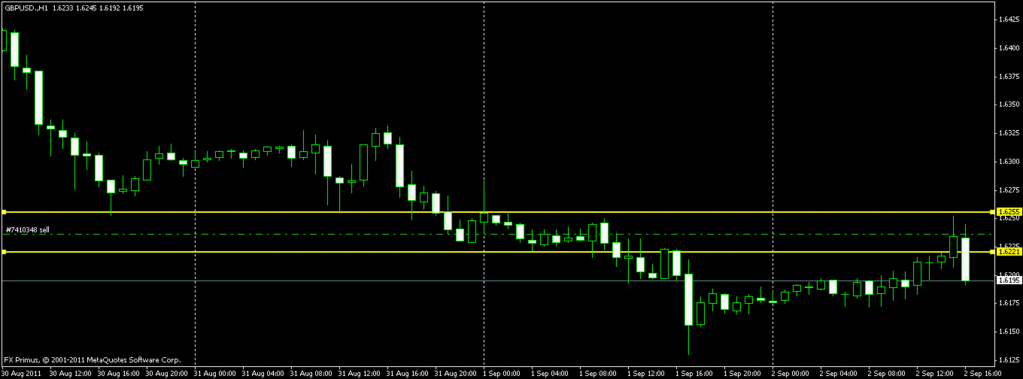
draw horizontal lines on immediate previous LL or HH and watch where prices bounces off. Once you start catching a bouncethan we can safely say you have caught one wave. Next watch for the next resistance or support area where prices ranged on the immediate preceding wave. Mark the high and the low of it. Watch how current price behaves at that area. So on and so forth. You would be able to see clearly what I mean by support becoming resistance, resistance becoming support. Use H1 chart as its the best for micro analysis.

  1. Should I open a chart and mark HH, LH, LL, HL? Is this consider waves?

You can do this as you are trying to learn how to read waves, but be careful of one obvious drawback. You wont be able to say which is going to be the HH or LL until the move is complete. That makes it a a degree of hindsight. Which is of no use when you need to make a trade call.

What you can do is once you have marked the area of HL or LH etc, draw a horizontal line on that area and zoom in and out of H1 H4 and D TF chart. You will see previous resistance and support area there. These are what you have to pay attention to. The idea is to be able to pick these levels up before current price moves to that area.

  1. I guess waves happen on any time frame. For example Daily, H4, H 1, M15?

Yes you are right. But trying to read waves in M15 or M5 for the matter is much much more difficult because of all the noise in the chart. H4 posses a different problem. H4 is much more cleaner but you have to be able to catch price swings from the HH or LL areas. You dont get much chances to re enter in the middle. Even if you do, your SL wont be as small as picking it in H1 charts.

I would personally advocate H1. It allows newbies to pick SL as small as 10 pips. And the candle pull backs etc are easier to read.

  1. Do you have any preference which time frame you use to mark waves or monitor?

I mark on H1 and then check it on H4 and D TF. A good strong marker would show a bounce or rejection on many TFs.

I hope that helps.

The technique is not to throw away what we have been looking at for the last 4 or 6 weeks when we chasing waves.

The waves are of no use if you dont have your board with you!.

Try to trade the same way as you been using the communist system. Now just use the waves as the filter to pick clear trades. No more guessing if each pull back candle is the one.