Pure Price Action For Dummies

Hi membina,

I just need to find out first what you are doing before the entry and during the open position and once the position hit stop loss (SL) or profit( TP).

Do you know your weakness, do you know why you have some winning trades and why some loosing trades.

Are you doing different things before every trades or you have some fixed plan to go through before every trades.

Hi sharebazar

this is what i do daily:

  1. look at charts (the majors) an hour before london opens
  2. look at the candle from yesterday - if red candle, sell, green, buy
  3. wait for london open using hourly charts
  4. Determine the position of the candle when london opens using S&R lines (i know nikita doesn’t use them, more of a confirmation tool for me - if not necessary, please tell me and then i’ll trade naked charts then)
  5. if the candle at london open is in no-man’s land - in between S&R - no trade. monitor hourly till candle is at these lines to see reaction
    6.stop loss at previous hh / ll for sell / buy
  6. if stoploss is hit, i will take a reversal position (say if sell and stoploss hit, i enter a buy). works at times, doesn’t as well at times. should i even do that since momentum is there?
    7.Closes all trades an hour before london closes (i need the sleep for work tomorrow)
  7. Whether trade in profit / loss, all trades closed.

some questions, if i may ask for help in:
a. if the day has red news day, for example, at 4.30pm GMT+8, should i wait for news and enter position after the dust has settled? if there’s many red news day like yesterday - should i not trade then?
b. If the candle is a doji at the S&R line (on the hourly that fits the bias - should i just enter buy / sell? This is a bit aggressive i think, but also to reduce the stoploss).
c. Nikita said that if there’s a loss most likely the bias is mis-read. I may have to ponder over this and re-look entry point.
d. How do you know if the candle ‘confirms’ the bias to enter? - I think this is my stumbling block - the losses were when i thought I had the bias right, so my query.

sorry again for asking so much… am re-reading the thread…now at page 5.

appreciate your help.

Please see the answer below your question.

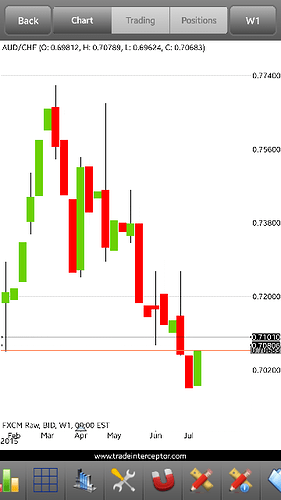
What do you guys think about this AUD/CHF pair.


It is a good and informative thread. My trading style is also a bit similar but I trade H4 most of the times with some candle stick patterns and 2 EMA are my trading tools.

Hi sharebazar

thanks for your honest replies. to make it clearer:

  1. i look at daily candles and enter on hourly since i day trade.
  2. SR lines are colour-coded, drawn for weekly (most resistant / support), daily (resistance / support) and 4 hourly (see the candles in perspective). too many lines?
  3. the reason why close depends on whether i am buying or selling and the interest for keeping the position open. say i sell audusd, but trade going against me, the stoploss if hit plus the interest is really a dampener. Please correct me if that’s not the thing to do. Maybe to sleep better also…:slight_smile:
    4.like yesterday there were big news from 4.30pm, 5.00pm, 5.15pm, 7.45pm, and 8.30pm GMT+8. the windows for a trade is practically from 9.00pm GMT+8 when US market opens.

“Candle don’t confirm bias.” was your reply to my last question. Is my understanding correct to say that when yesterday candle is down, today will be a sell, so we wait for one of the 6 candle patterns NikitaFx looks at to open a trade. does this also mean the the candle has to form when the 1-hour chart closes, or we look at higher TF for these candle patterns to open a position?

thanks.

on a sidenote, how many pairs do you look at since it is a full time commitment for you? and what are these pairs? do you scan for pairs at the opening of a new candle based on weekly (look at it once a week or based on daily (look at it once everyday) but uses weekly as a guide to the more dominant bias?

I do not look at exotics as i try to find pairs with low spreads.

thanks again.

my two cents - time to learn if there’s error in analysis.

  1. trend down (nikita uses bias, no trend analysis)
  2. retracement ? look left there’s a wick before the bias turned up.
  3. current candle if closes green - bias change to up day - buy?
  4. possible tp - top of wick two candles before, coincides with the tweezers further left.
  5. possible stoploss - bottom of red bar + buffer.

thanks.

  1. i look at daily candles and enter on hourly since i day trade.

In my opinion it is ok to look at daily and trade open according to 1HR candle signal.

  1. SR lines are colour-coded, drawn for weekly (most resistant / support), daily (resistance / support) and 4 hourly (see the candles in perspective). too many lines?

It best to stick with higher TF SnR like weekly and daily.

  1. the reason why close depends on whether i am buying or selling and the interest for keeping the position open. say i sell audusd, but trade going against me, the stoploss if hit plus the interest is really a dampener. Please correct me if that’s not the thing to do. Maybe to sleep better also…:slight_smile:

If you open a position and you can’t sleep that means you are taking more risk on individual trade, need to work on position size and risk management.

4.like yesterday there were big news from 4.30pm, 5.00pm, 5.15pm, 7.45pm, and 8.30pm GMT+8. the windows for a trade is practically from 9.00pm GMT+8 when US market opens.

Leave the news in your check list but don’t follow it religiously now, once you know the concept you can use the news as another tools for profitable trade. But try not to open a position before the major news realease.

“Candle don’t confirm bias.” was your reply to my last question. Is my understanding correct to say that when yesterday candle is down, today will be a sell, so we wait for one of the 6 candle patterns NikitaFx looks at to open a trade. does this also mean the the candle has to form when the 1-hour chart closes, or we look at higher TF for these candle patterns to open a position?

As you are trading on daily candle, look previous day candle if bearish then today is sell and vise versa. But we wait for the lower TF to give us signal around SnR area by forming thise 6 types of candle like doji, engulfing, etc, pin bar type is more effective.

on a sidenote, how many pairs do you look at since it is a full time commitment for you?

I look for almost every single pair at the moment, because I am very much selective about my position.

and what are these pairs? do you scan for pairs at the opening of a new candle based on weekly (look at it once a week or based on daily (look at it once everyday) but uses weekly as a guide to the more dominant bias?

I am looking at weekly and daily candle but mostly weekly which give more profitable trade. I look at every sunday to get an idea which pair I will need to monitor for the week and then check every 1HR or 4HR.
hi sharebazar

thank you for your pointers and insights on your trading philosophy. i guess the want to build up the account in haste is giving me the jitters in keeping the trade open.

another question if you have the time. what if today was a sell based on yesterday’s sell, but the movement of the candles have proven otherwise. is it better to cut loss or just let it hit the SL?

i am talking about USDCHF which i have a position on. did i read the bias correctly, and is it a retracement? or the bias has changed?

thanks for your insights.

Hi John085,

Good to see you here, yes this thread is very informative and very good for traders who really need to understand to basic movements of the price, how the price move one step to next step.

another question if you have the time. what if today was a sell based on yesterday’s sell, but the movement of the candles have proven otherwise. is it better to cut loss or just let it hit the SL?

i am talking about USDCHF which i have a position on. did i read the bias correctly, and is it a retracement? or the bias has changed?

Hi membina,

Cutting loss is very important factor in trading, if you have SL in place then that means you are willing to take loss if the trade goes against you.

But how do you know that traded goes against you because if you follow the bias then price can hit your SL then start in direction again.

Again if you close your position before it move to your predicted direction then you just close the position early without any confirmation.

We need to understand that we are not going to make profit in every single trade, but when we lose then we have limited loss and when we make profit we have at least 1:2 R:R or more so it is vital that we let our profit run and trail the stop accordingly.

And regarding USD/CHF pair, you have opened position but is it long or short in what price and why you opened the position.

hi sharebazar

thank you for taking the time to reply.

sorry i can’t post charts, it would make it easier for anyone seeing them to learn something from.
ok, my usdchf position was opened at 0.94511 for a sell.
reason was the previous daily candle was a sell, so today was a sell. stoploss was at 0.95335, tp 0.93751 (previous hh- resistance and ll- support)
it was in a range before the breakout. I think the yellen remarks pushed dollar higher which took out my position.
I want to know if my reading of bias is correct. if it is, then the loss is acceptable. if it is not, i would like some help in improving the bias reading, since a wrong bias is as good as a high probability of a stoploss being hit.

thank you.

Hi membina,

I have draw the horizontal line on USD/CHF pair,

Red line = SL
Blue line= entry
Green line = TP
Your Risk:Reward 1:1
And

Red arrow down I assumed you take as daily bias which is bearish. 13/07/2015

Green arrow up I assumed that you open position on this daily candle. 14/07/2015


Is this correct according to your previous post, if not then what day you opened position and what time.

Hi sharebazar

yes. spot on . your views on the entry, exit and bias reading, if i may ask of you please.

Hi membina,

Your bias was correct to go short on 14/07/15 because 13/07/15 daily candle closed bearish.


I believe you entered some where inside the box marked on the chart.

But your entry was early.

When we go short we need to wait for the price to come close to resistance then wait for the smaller TF candle to give us signal to open position according to our plan. Your entry was not near the resistance.

As you trading on daily candle always look SnR on daily or weekly TF.

hi sharebazar

thank you for the honest opinion. I am glad the bias reading was correct, and the entry would not have been taken when there was no candle to signal to open a position.

thanks. I’ll ask for more help from you if i have further doubts. back to the markets.

Hi membina,

In trading we face lots of uncertainties and difficulties, as a trader our main job is to reduce the risk and save the capital by any means.

We need to be carefull and throughly analyse the market before we open position in any pair. Suppose in present market condition USD is stronger than most of the currency, so it is better to avoid short positon on USD.

Compare to other CHF pair like NZD/CHF and AUD/CHF is much more weaker then USD/CHF pair.

Hope I have managed to shed some lights.

Hello everyone,

Hope you guys are doing good.
Just closed my both AUD/USD pair position with 425 pips.


[QUOTE=“sharebazar;711954”]Hello everyone, Hope you guys are doing good. Just closed my both AUD/USD pair position with 425 pips. <img src=“301 Moved Permanently”/>[/QUOTE]

Nice work!.

Thanks Shyfx, nice to see you here.