I disagree that you have to spend hours and hours analyzing the charts. Once you know what you are looking for, there really is no reason to spend hours and hours analyzing the charts. You just check the daily or 4 charts a few times a day for maybe 10 to 20 minutes and that’s it, at least that’s what I do. Most traders over trade.
I agree and disagree with your comment. Why is simple yes once you understand the markets. Even on this thread and strat offered here you read the daily (and read the daily chart in case of signs of reversal on the daily that could change the bias from up candle yesterday means up today to the opposite) then drop you the 1 hour. When you understand your charts on the pairs you look at. You know how many hours it will most likely be till you get an entry on a pull back. Most of the time you will be right. Other time you either miss the boat or have to wait longer (thats life). However (I a only speaking for myself here) I dot feel you get that understanding of the pairs you trade by only watching charts a few times a day for a few minutes. Now I will watch candles play out for a while if I expected an entry and have to wait. To watch action within those candles. I cant tell you how many time I have seen a candle spike up then trickle back down. Only to spike up again and trickle back down. Thats big money getting long right there. This can happen when I was about to go short and guess what I sit on my hands just to see price all of a sudden jump hard to the upside and would have stopped me out. You get that just looking at how a candle opened and closed. Another example I have seen to many times. Is a hammer forms on a support level but the wick is to long for you to be able to put a stop there with your risk management. Lets say its a one hour candle. I will wait for the next 30 minutes (first half of the next candle) to go down to about the 50% mark of the hammers wick. If it hits that I will go long now at a price more affordable as you just cut your risk in half. Generally speaking the candle will reverse (not every time but happens alot). Now your watching the charts for 20 minutes might have caught that if you are not swapping to all different charts.
Now on the other hand I agree. Once you understand the way your charts move you can expect these price movements and pretty much see them coming long in advance. But you only get there one way and thats chart time
Took basically the same trade on Aud/Jpy. Moved stop to BE +5 after a couple hours of choppy sideways motion. Kinda wishing I had held on for the Asian open.
Bobmaninc, thks for your recommendation. woohoo… this app is way better than the MT4 tat i was using. i will try it on my ipad too…
Hi Nikita,
Thanks for referring me over to your thread on PA. There are definitely some excellent ideas on trading in your thread before even getting into the PA information, points you have mentioned related to the psychology and discipline needed to trade effectively.
I am trying to delve into understanding the PA information right now, and I just have a question on a statement you made here: “Example : when there is a hammer or tweezer pattern on your D TF Chart, wait for a confirmation candle in D TF to strengthen your analysis.” Did you mean to put ‘H TF’ for the confirmation, or am I not understanding something?
If you are looking at the previous day candle, and then you need confirmation inside of an hour candle during the current day, that makes more sense to me, but perhaps I missed something.
If I am understanding the PA method correctly, yesterday’s signal on EUR/USD was bearish, and so I should have expected the drop that we are seeing right now (10:13 AM EST) and could have gotten in at a higher end of it and waited with a short to collect some pips.
On another note, I appreciate it when I find people that are willing to educate and share constructive criticism, rather than getting flustered and just throwing out the standard ‘troll’ insult within two or three postings on a thread. You are intelligent, and seem successful, yet appear to continue to be graceful and well-mannered, which is an admirable quality.
Thanks!
sean
EDIT: I think I glanced at yesterdays candle wrong…it is bullish, right? How would that have played out with a trade today? Hopefully you can clarify so I make sure that I understand the method correctly. I also tried to look back at the D TF candle from two days ago to see how a trade yesterday might have played out, and I’m not seeing a clear path to what would have been a good trade yesterday either. Is this where the other currency signals would have come in to play? I was trying to ignore looking at other currencies besides EUR/USD so as not to complicate things for myself until I had the general PA understood well enough (which I obviously don’t yet).
Happy to help
Hi bobmaninc I also like the apps, it is better than the other apps. I am using it now, thanks for that.
Any trade today, I got 12 pip today, got out early, unfortunately I have to go out can not stay long, never mind Market always will be there.
glad you like it as far is charting apps that is the best one I have used. Like I stated before depend on what broker you use you may be able to trade from that app. I think they have a list of brokers that you can trade with on there web site. Prett accurate to for charting on phones go.
Well I got burned earlier today trying to short CHF (after almost a dozen winning trades too!), but I think I might be willing to try again depending how things look at the top of the hour :-/
I just want to say thanks for this thread nikitafx. I really have learned a lot from it and am finally becoming profitable after almost 2 months of losses. I have to say, the thing that has really helped me was you’re comment about first and foremost to not lose money. I have BE’ed more than too much of my trades since reading that, but I’m happy to say that my account has been steadily growing and not shrinking for the last few weeks. Now I just need to learn when to hold on to trades and when to let them run (which is a [U][I][B]huge[/B][/I][/U] problem of mine right now).
One thing that has also helped me out is that I usually enter a trade on two correlated pairs at once with half the normal lot size each. This has helped me on more than one occasion. One pair might get stopped out while the other hits my TP, or one will move a lot more than the other (happened yesterday when I was in both EU and AU at the same time).
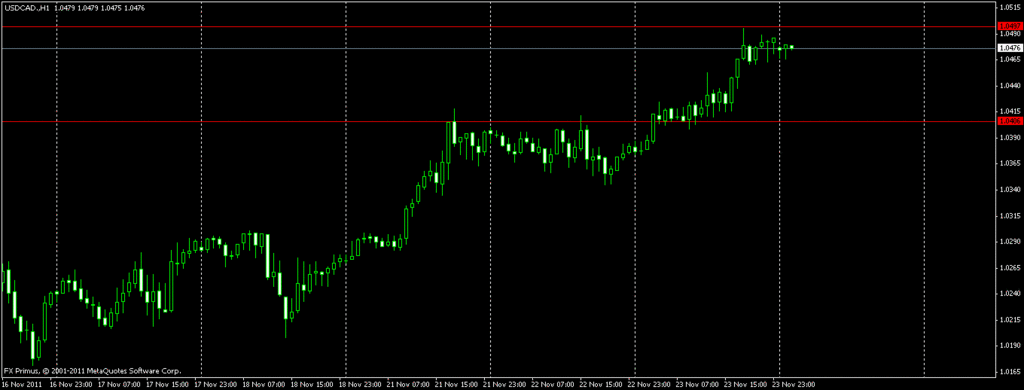
Any thoughts on whether or not USDCAD will move up to 1.05557 after the current stall?
When a trade goes the way you had reason to believe it would, your trade is then “in the groove” and you are in a position to let your profits run. But keep an eye open for any slowing of the trend’s momentum, as where other traders have lost their enthusiasm. A trend without momentum is a trend worth leaving, get out and stay out, but strong momentum can make big pips. That is where going to a very short timeframe can help in getting a sense of a trend’s momentum.
Looking at USD CAD I dont know if it will move up or down off hand.
But looking at higher TF at this point in time I dont see it coming down just yet. It still has a little move up north to hit a significant resistance.
If for some reason you are seeing a short, than the following would be your basic SL and TP areas just to give you an idea.
USD CAD H1
On strongly trending moves, we can afford to wait for a second confirmation candle on D TF. How do we know if it will be a strongly trending move? There wont be any previous consolidation areas around it, especially on the immediate wave.
Otherwise, we use H4 and H1 signals and pick a valid area where we would get out of the trade. I always look for an exit first and not just be blinded on what is the potential profit going to be. So I guess the answer to your question would be, use what is available to you to make the decision.
As for drops and ups, D TF gives you an idea where its going to eventually end up. Its our basis for smaller TF PA trading.
The next level is to figure out where to short, at what price to short and TP on a TF smaller than D.
This is where PA is the same for all TFs. There is a PA trade going on at all levels at all times. So it all comes down to which TF PA we are trading and what are the levels of SL and TP.
Thats the only question. What are the levels of price. PA is just that. Price levels.
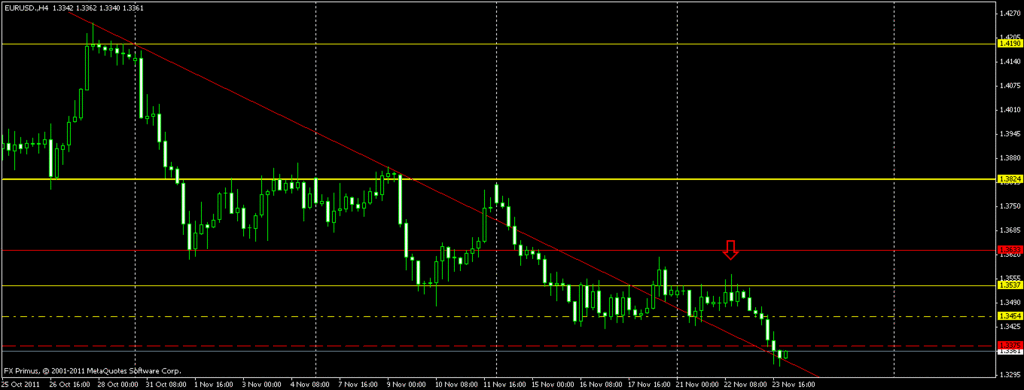
Below is a chart on EU to explain this.
EU H4
The arrow marks an area that should have got our attention.
Note here why I always say be patient. Be patient and if you are not sure, be patient. That is three H4 candles building our PA entry. That means a solid 12 candles on H1. We had about 12 hours to make up our mind that its going to fall.
So dont worry if you are late by 10 minutes. Take the extra time to look at the charts again.
The horizontal lines mark S&R levels on H4 and adjusted a tad on the H1 for a best fit. Play with the zoom tab on your MT4 chart. If anything, it can give us a glimpse of what might happen on days when things are not so straight.
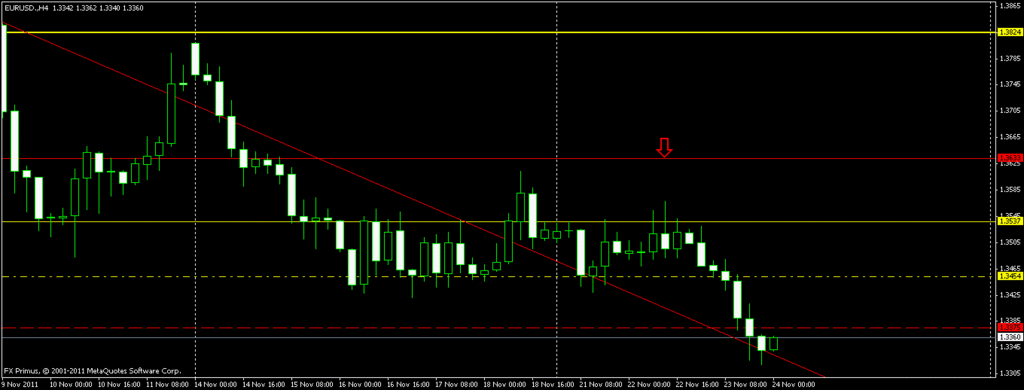
EU H4
So our H4 candles confirm that the resistance looks valid. We enter in that opening of second or even third H4 candle opening or higher up on the wick and our SL would be anything from 5 pips to 40 pips max.
The RR on this one as where price stands now would be 1:5.
Anything at and above 1:2 will not cost us our account, even if our profitability % is only 50. Actually 4 winning trades and 6 loosing in a series of 10 will still ensure that your account grows if your Risk to Reward ratio is 1:2.
And on the final bit, well it all depends on how a person asking the question is putting the question.
If they have read the thread, atleast the first 10 or 15 pages of it, than they will be asking the right questions and we wont have a problem answering them. We all know if a person had read the thread or not just by the question they are asking.
Those who are impatient and do not read a thread but come in and ask a very basic question that has been explained in details are the ones who usually do not get a proper answer.
If we are impatient and dont even have time to read a thread, than our impatience will never allow us to be traders.
I hope you find my answers to your questions helpful.
welcome to the club. The BPC didnt work. had three opportunities to cut off with 20 ++ once, 18 on another and the last time was max 16. It happens.
Hello Nikitafx and other posters …
I have been studying the P.A. thing in W, D and 4hr for some time and I am finally getting the hang of it.
Nikita, you have presented this P.A. work in the most brilliantly simple form I have seen so far, thank you.
I have a couple of basic Q’s for you if I may, so late in this thread …
What does this mean “Preferably UK open ( 3pm GMT + 8 ) to US close ( 5am GMT + 8 )” ??
Clearly “3pm” is 3pm in whatever country one is in but “3pm GMT + 8” defeats me totally. I live in West Australia which has a time zone “GMT + 8”. Maybe “3pm GMT+8” means 3pm in West Australia?? I dont think so.
Secondly: You mention the 6 basic candlestick patterns. I am quite familiar with candlestick patterns but which 6 are you referring to? I have searched your thread for an answer but no luck.
Thank you for your kind remarks. Given a chance I would have modified certain areas of the thread so the flow would have been better.
Well I am in Malaysia and 3 pm my time i when London opens. I am assuming its 8 am London time. So market usually moves an hour or so into or before London opening. In other words I am in a place where we are 8 hours in front of London.
If WA uses the same GMT +8 than we share the same time zone and your time would be the same. 3 pm your time would be around the time market becomes active. ( Its 4 pm now for us in the tropics because of Day Light savings adjustments. Secondly its not something that is set in stone, market times. Sometimes it moves as early as 2 pm. Sometimes as late as 4pm. Its just a time to be on the look out and pay attention. )
Finally I admit we dont find any candlestick pattern pictures on this thread. Wanted to do it but became too lazy.
Ill put one up today.
OK, thanks again Nikita.
I did wonder if you were in my time zone. Now it all makes sense to me ( a slow learner, lol ).
Re the candle patterns, I will simply apply the ones I favour. With your approval I will post a couple of pics with what I look for regards candle patterns.
EU H4
I wanted to talk about this for a long long time but never got to making a chart to explain what I meant.
Since I saw a chart that i could use, I decided its time we talked about it.
We see three horizontal lines on the chart below the red arrow.
A Yellow solid line marking the top of the range that we call resistance.
A Yellow broken line marking the bottom of the range we call support.
Then the last Red Line at the bottom is support from a previous wave.
When we look at bias on higher TF and we want to buy when prices are ranging, regardless on what smaller TF it is, we would ideally buy as close or on the yellow broken line. This is what is called buying low.
When we are anticipating a sell on higher TF, we would sell as close as we can to the solid Yellow line. If not as close, preferable on or above it. This is what we call selling when the price is high.
Its important that we try to do it as high or as low as possible for a few reasons.
one of it is to minimize SL. This also allows us to move our SL to BE as soon as possible and the chances of prices hitting our SL as soon as it breaks the range is very rare.
Thirdly, profitability sky rockets. Pip count becomes much much heavier.
This is opposed to those who wait for the prices to break out of range. When it breaks out of range and we enter, like in this case selling below the broken yellow line, than our SL is the top yellow line. Which makes our SL really really big!. On top of that, we can always end up being caught in a fake break out.
Fake breakouts are one of the main reasons PA traders who trade breakouts loose money. The SL for fake break outs are huge.
Finally, those who are capable of trading in this manner are profitable when markets range. They can collect the 20 or 30 pips in between a range because their entry is solid. They always bank in pips no matter what market conditions are.
This is a public thread. All are welcome Fairwind. Please do share.
Buying low Selling High
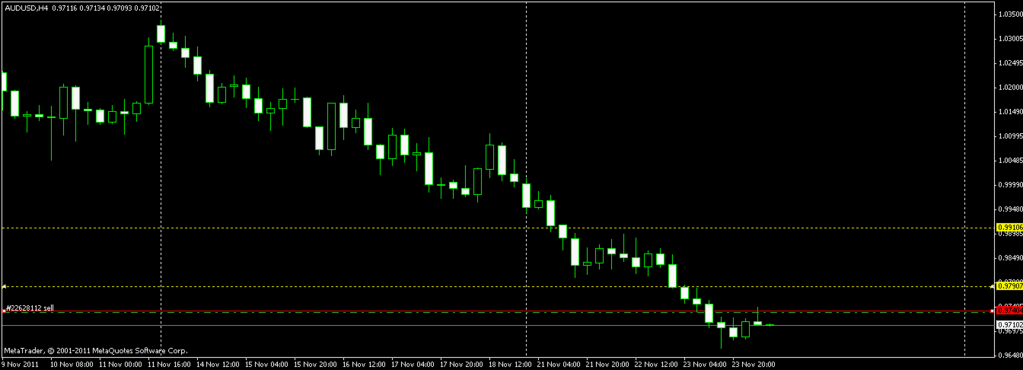
AU H4
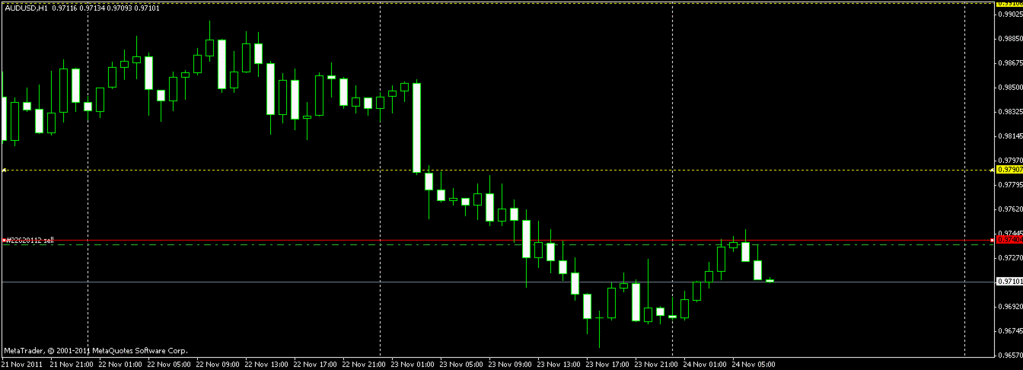
AU H1
AU Min 15
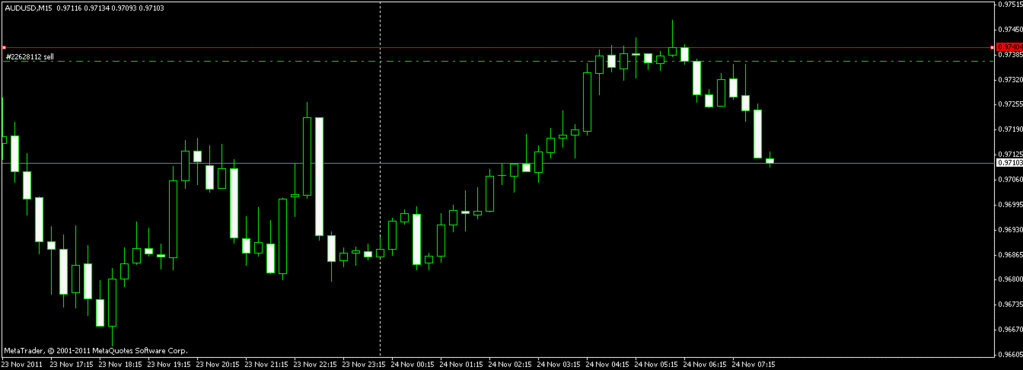
Pay attention to how close the price came back to touching entry point on the 15 min chart. Its 28 pips now and its safe to move it to BE.
It either drops or hits BE and turns. It will very rarely hit BE and than fall when our entry is this high up.
I entered this trade using the pullback candle at the top of the min15 chart after drawing the Resistance line on H1.
Again dont think too much on this if we are just starting out on PA.
But keep this at the back of our mind as we are looking for entries.
