GU H1
In answering Kummi90s question, do you recall the Rubberband theory I talked about earlier? Price moves like a rubberband. It bounces, pulls back, and does all the other in between.
We want price to go in the direction of bias only when we are already in a trade and we are holding a profitable position. Then smack comes news and pushes the position another 50 or 100 pips into profit.
I dont like to do that because its a very big IF. IF news goes our way. What IF it does not?
So I rather wait for the news speculation action to be over and the bigger carnivorousness beings are done, then we sneak in and enjoy good pips without the hazards.
So on days where there are major news, I tend to TP early move it to BE atleast and then wait for news to be over. You might miss 3 trades this way, but the forth that you catch will be much much more profitable than trading speculatively.
Many in babypips chat room the other day shorted GU I think, after the news, thinking that it will do the same thing it did last month, fall further ones news was over. Well sorry to say but last months news events, the bias was already sell, last Friday it was a buy.
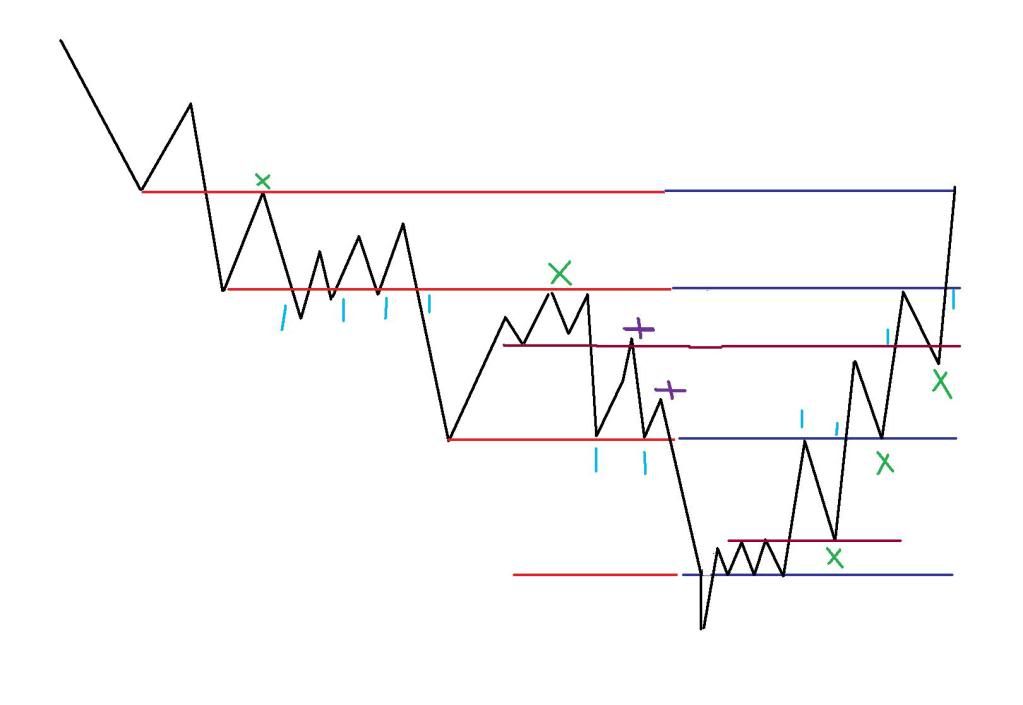
Now back to the chart.
we have a best fit horizontal line that was previously a solid resistance area and was broken on Thursday after the news event. ( its the red bottom line )
Always remember when resistance is broken, it will become a support. The arrow on the chart shows the candle that confirmed that it was going to go up after retesting the price that it broke the day before. So buy after that candle finishes and put a SL at the bottom of that wick.
This method of being patient and waiting reduces false Break outs.
Look at the yellow tick, shows the same type of candle, again after resistance was broken and retested, in this case twice. Where did I get that line?
Go to D TF and draw a line at 1.5572. That is my support / resistance area.
Then come back to H4, I adjust the line again to those candle patterns. Try to get a best fit. This now gave me 1.5570.
Now I go into H1 and look at the charts, I adjust it again to about 1.5577. Best fit line for a support and resistance.
I didnt take the morning bounce because
-
I dont know if that is a valid support resistance area. was not very confident.
-
I dont like to trade asian session because its slow and there are too many false signals. So I let it be and when it bounces again second time I took a position much higher but with smaller risk cause SL being huge.
Top red line is todays trade. I got the line at 1.5628. Again I got it from the D TF chart. Then I looked at H4 and there was not much adjustments I could do. So I go down to H1 and hey its sort of looked perfect.
My entry was not perfect. As I am typing this I am currently holding - 6 pips from a maximum of 25 earlier. Did not move SL to BE. Hope it goes back up.
EU H1
Bottom yellow line. Resistance for days, then breaks upwards and then on Friday it retests the line. Monday morning I took a small buy where I marked with an arrow. I got out at the dotted red line with about about 30 plus pips because it was the Asian session and I was keen to bank in the first profit for the week.
Dotted red line, 1.3451, again same method, look at D TF, then best fit for H4, then fine tune at H1 and I get that line.
Breaks up and does a small come back to retest the line. Now I was looking at this entry where I have the yellow Tick marking it. SL was about 10 pips, but yet I did not take the trade!!!
Why? Cause Im thinking well bias is a sell and correlation is all out of whack and I am not sure, well Ill wait. And I waited and waited and waited while it just kept going up and up and up.
So between GU and EU, I could only afford GU with a smaller risk so I took that.
I remember telling a few who were chatting with me to be careful if they planning to sell because I really dont see a sell just based on that one candle that dropped on Friday. I was right. But I still didnt make much money! 
The reason I avoided a sell is because I was looking at the Resistance broken and becoming a Support. So prices might shoot down but it wont break that point.
So I hope you can see how the entire process of trading gels together Bias, higher TF and lower TF and finally candle sticks to maximise chances of profitable entries and minimise losses.
I dont profit on every move, even the good ones. I still miss some fantastic pips, and I still make mistakes at times, loosing some money.
So if you are getting on the red once in a while, its ok. Its trading.
There are no 100% profitable method or signals out there, and that includes correlation and bias. But with practice, you can reduce your false trades tremendously.
Right now I am holding -1 in GU and BE in EU. I had 35+ in EU and 24+ in GU. I have to go see what am I going to do with it.
Hope that answers your questions.