Pure Price Action For Dummies

Sharebazaar, I dont think market times are as important as valid set ups and direction.

London opens and what are we going to do, buy or sell? So decision to buy or sell is more important.

If we follow proper S & R lines and wait for candle patterns with bias confirmation, we dont have to worry about SL size, it will rarely hit our SL. Most of the time it will be in profit very quickly.

Regarding SL, adjust your risk accordingly. Bigger SL, smaller lot size so risk stays manageable. That is one way.

Another way is to wait for H1 candle to conclude before taking a trade. Do not attempt to enter once price has moved.

It takes patience and discipline, not to mention the ability to watch charts at the end/begining of each hour.

Hi Nikitafx thanks for the advice, like today Market open and go up but the bias is sell what you do in this situation at GU pair.

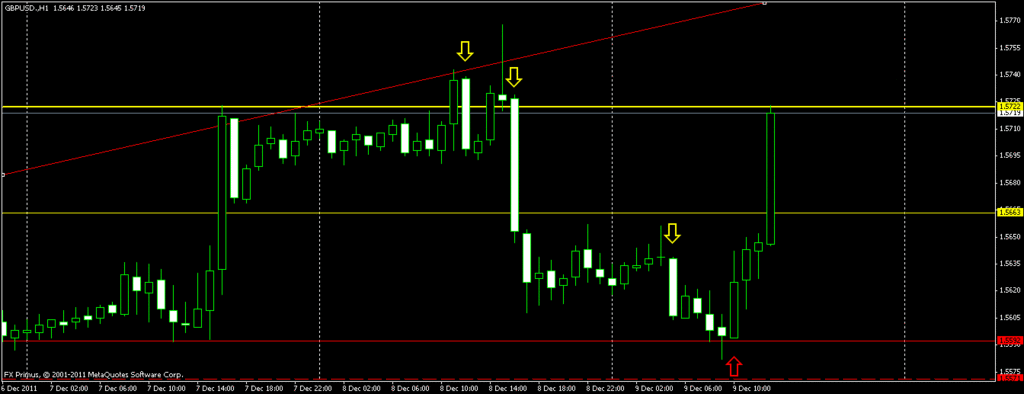
GU H1 TF

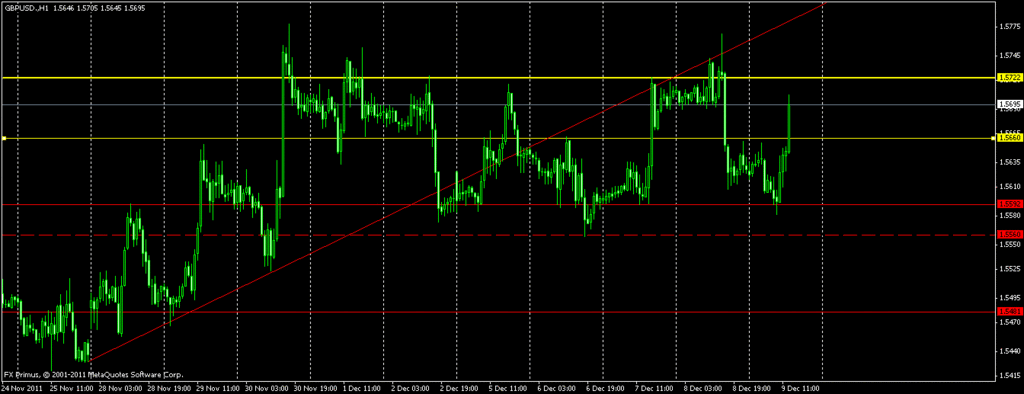
This is my chart. Please note the trendline drawn on H1 that also applies to H4 from previous LL HL HL etc. This comes heavily into the reason I traded short on GU this week.

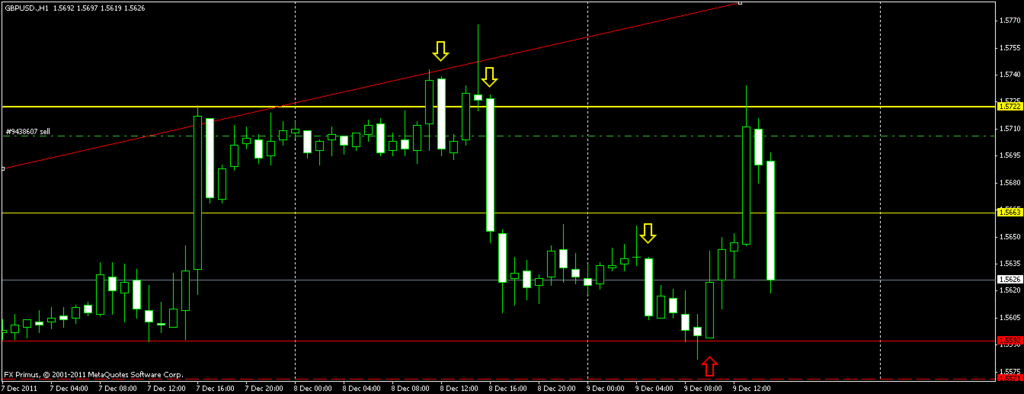
GU H1 TF

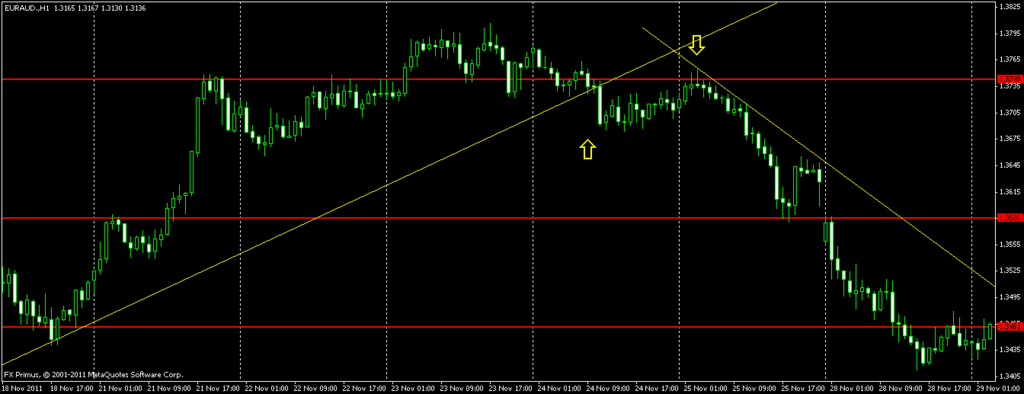
This is a zoom into the same H1 Chart. The yellow arrows mark the places where I shorted yesterday. First short I took 30+ pips and i cut it off because price hit the support below it and there was alot of news so I did not dare to hold for more. The reason I took a short because it touched the trendline.

As expected during ECB news yesterday market shot back up. It hit a high and there were big orders wholesale for a short I think. Those trades triggered and before the hour was over, it was back down.

This provided my second entry for a short based on rejection from the same trendline and pull back candle. This one I held for a little more because the momentum of the market was strong.

I didnt short EU because the pullback candle or pin bar was not there. AU was the other one I shorted because of the clear signal.

The third yellow candle was today. I didnt take that trade based on bias because I was out to meet a friend.

Now the fourth red arrow for a buy is a valid entry if we play by S & R lines. But its breaking rules to enter against bias and I dont know how far it will retrace. It looks like its back into the range. Missed pips but as I always say, market will always move. We cant catch all. Make sure the 3 or 4 trades we take a week are profitable.

GU H1 TF

Last trade for the week

77 pips.

Get familiar with the rules of how to trade this simple system. Than keep repeating it again and again.

Market will give you.

Remember, its not random.

wow! as always you are impressive… :wink: I like the way explain your trades very detailed and simple… thats why im always checking this thread… :wink: if its not too much to ask niki. could you pls post more charts on how you draw trend lines? thank you…:slight_smile:

patience is always rewarded

Thanks for the great explanation, I am following the rule very carefully, I have learned a very good lesson that is as you mentioned it is not random, and

wait for the signal. Wait for the entry. Wait.

And if not sure, wait some more.

The patterns are not subjective or complicated like head and shoulder or flag poles or butterflies etc.

Its just pullback candles. One candle pattern most of the time.

Be patient.

Hi Sharebazar, based on market bias today is a sell you are right. I shorted EU on Asian session and made close to 30 pips(even though I told myself not to trade today but the hammer was sooooo inviting that I had too!). I could have made close to 60 pips if I hold it but alas today is a tricky day due to the Eurozone news so I decided to just take it as my daily target is 30 pips.

I might not be the best person to give advice but I suspect you might not have read the candle signals properly as there were 2 entry points today actually.

Anyway there is always many other opportunities next week.

Have a nice weekend!

This is key! Patience and the mental aspect. Am still trying to master it but am some way off still.

Anyway added my Myfxbook link for my live account :

I think I did talk about drawing trendlines briefly somewhere in the thread but here is another example.

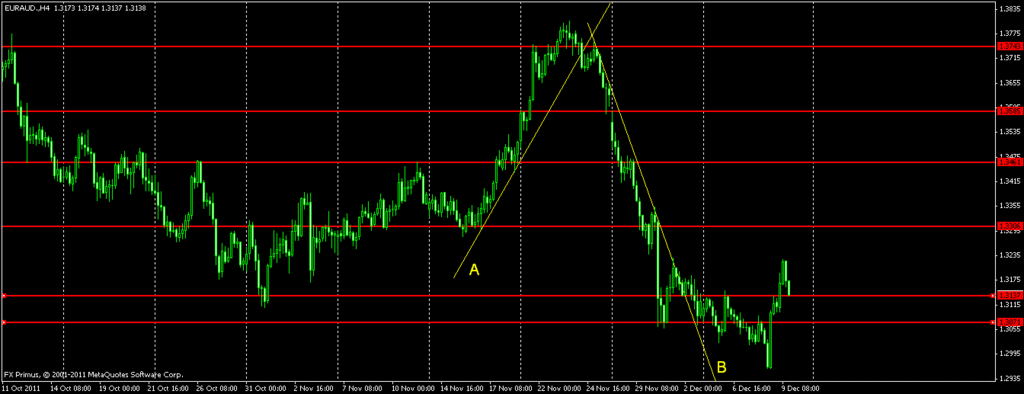
EA H4 TF

The trendline is drawn opposite. A trendline for prices going up is drawn below. A trendline for prices going down is drawn above or up of the candles.

The picture above shows trendline for prices going up, A and downwards B.

At the top it shows price breaking the trendline.

Traditionally people traded breakouts from trendline. Its not as easy as just entering when prices break a trendline. Just trading breakouts on trendlines will not be profitable. We have to combine it with other signals. But when combined, it becomes a very very powerful tool.

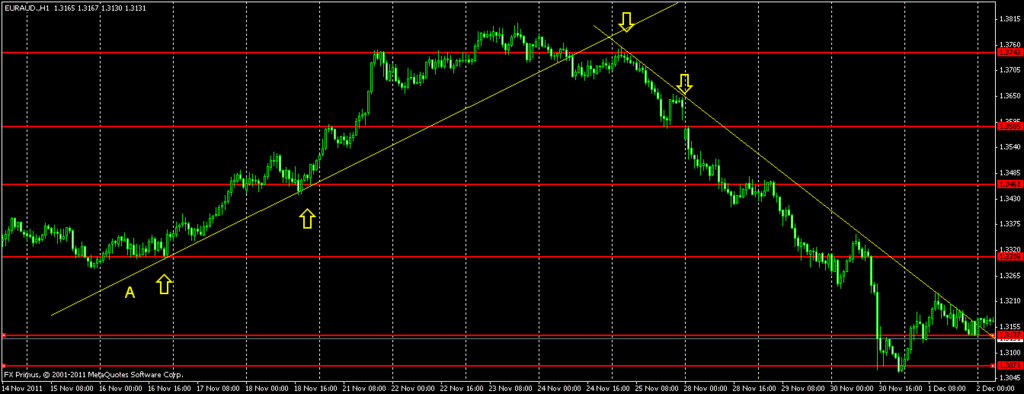
EA H1 TF

The picture above shows the points that were used to draw the trendlines.

We need two points of LL or HH to be able to draw a trendline.
The more times a trendline tends to be tested the more valid it is. In other words, more bounces off the same line means a well drawn trendline. This is contra to what we read out there that more times a trendline is tested, the stronger it is.

It does not mean that the trendline is getting stronger and prices will not break it. Matter of fact a trendline that has been hit a few times is ripe to be broken.

EA H1 TF.

This picture shows the same chart and where we picked the entry upon the trendline breaking at the top and waiting for confirmation on H4 and D TF.

This entry gave 600 ++ pips. Plenty of opportunity to short.

Please note how entering at the moment trendline A is broken would not have been the best entry.

Again note how prices broke trendline B but did not shoot up as expected but started falling.

So dont trade just trendlines if one happens to form. Prices will still obey S & R areas.

Finally, wait for pullbacks. BPC.
Hi teb5108 I agree with you regarding patience, I need to be more patience, as I am still learning how to read the chart pattern and the support and resistance and trendline.

finally finished reading all the posts… it is such a marvelous journey:35:

I hope i can learning a little bit from you, anyway, really Thank Nikittafx and other fellow. You all are awesome!!

Sorry it has become this long but after page 40 or 50 it was sort of rehashing the same thing.

Hi, nice to meet you. Could you leave a comment regarding this?

I just made a EU trade at 2.40pm GMT+8 at buy 1.3344.

  1. Friday is a buy for AU EU GU so probably monday is a buy as well. (Although it is not as accurate as normal on Monday, hehe.)

  2. The price level is well landed on a support level for a inverted hammer previous hour.

  3. I put a stoploss at 1.3317 since it is the HL previous wave, i did not put a TP as I would be quite free for few hours later

Sorry i try to put the chart but i think my post is not enough to do so.

Edited: Being stop out at 3:21pm GMT+8… sad…
Thanks in advance!

I took a buy on EU and AU also. one hit my SL for 12 pips, the other was 17 pips. I reduced risk because I was not sure and its a Monday.

I went out and I just got back so no further trades at the moment.

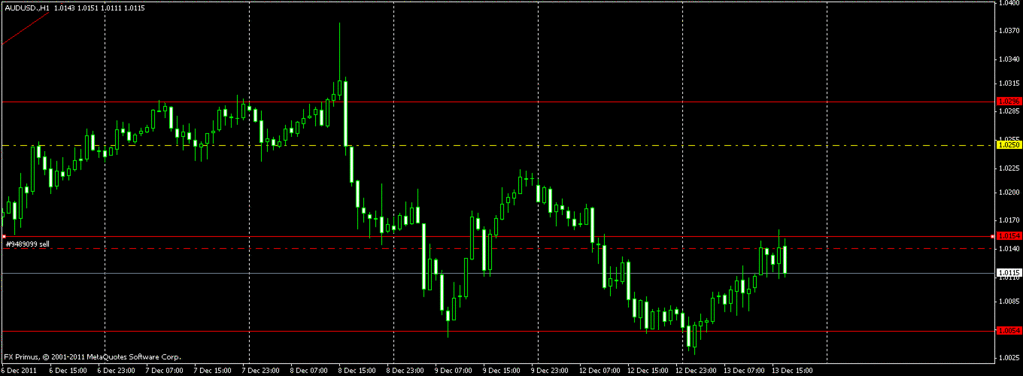
AU H1 TF

Moved SL to BE as its too rangy for my liking. Its about 43 pips now.

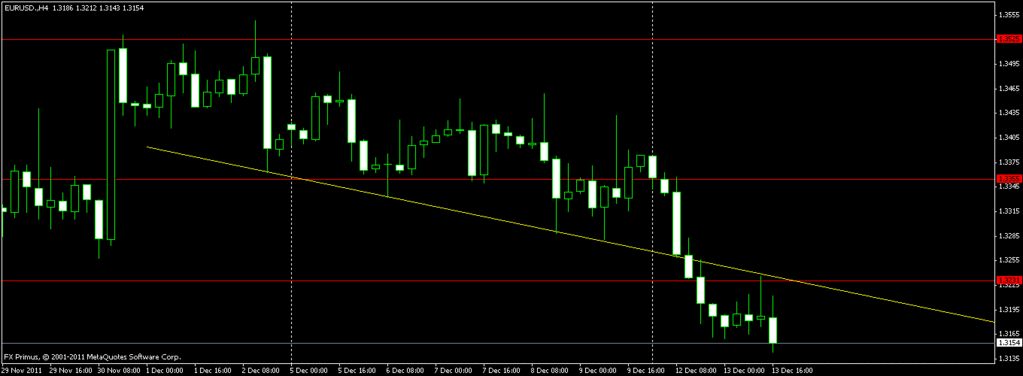
EU H1 TF.

Bebehto, trendlines.

I didnt trade this one as I was not around. So the AU is my only trade for the day.

I have thought of something today.

Its just an idea that came to me all of a sudden though I am sure others are doing this.

I think I might have a good way to further reduce our SL to about 15 pips or less per trade.

I am going to test it in the coming weeks before the markets go into a small range and see how it works out.

Who’s the OTHER FELLOW?

Hehe sorry Niki I quoted the wrong post! I see the threads going really well and you’ve changed a lot of traders lives for the better!
What’ve we been discussing here? I’ve been out for quite a while, mind rehashing what’s been going on?