Does anybody in here trade around 10am - 2am US CST?
Agree 100%
Good pointer on the MM part!
Anyway did slightly better than last week but am still down 80 pips for the week. Spending the long holidays studying the charts again. Am thinking of buying a forex tester tool to do back testing. Saw a thread on that just now.
Market’s Been really unpredictable this week I guess it’ll be the same next week as week as well due to the holidays.
I think market is always unpredictable,we only use probability to predict the movement of the market. with the Nikita’s method majority time market is in our side, when we are following the rule and act according to the rule.If we can predict the market everybody will become super rich…
This is very interesting thread. 25 pages on my iphone, gonna took a whole nite. 
Hi payahbleh do not rush while you reading the thread, take your time and read it carefully and try to absorb the concept, once the concept is clear,please try on the demo account.
Most of the common question is answered by the thread owner Nikitafx and other respected member of the thread.
Hi Nikkita,
I am a newbie. Could you expand on how you decide the trading bias for the day. Do you assume that if yesterday was an up day then today should be an up day also and vice versa ? Also if a reversal pattern has formed but not confirmed, how do you deal with this ?
Thank you
didier
Candles on all TFs form and end in the same way. They dont behave differently just because its a different TF.
If you have the screen time, watch say the Hourly candle and see how they start, form and end. Than compare the direction it went in relation to the previous candles. That is how I came across this idea.
Now we pair this with S & R areas. Previous bounce areas are where new bounces tend to happen. History repeats itself.
Reversals are confirmed on lower TF. Watch for candlestick patterns in these areas. The LL or HH of this areas will be the SL.
Hi Nikita
Sorry for the intrusion.
I have not read the entire thread, just the first few pages, so if my questions are a bit lower grade, please feel free to
ignore me. (I hope you wont)
When you spot a reversal candle on the daily chart, you look for confirmation on the 1 hour chart, or you wait for the daily chart to confirm it? In other words, a whole day later.
I use to wait for a whole day for confirmation until Bobmaninc pointed out the smaller TF charts.
Now I take the second day candle itself provided the turn is at the LL or HH of the D TF. In otherwords, the bounce or reversal on D TF has to be a valid one and not in a confluence or ranging area on that TF.
Ok thanks, got it.
How does this part fit in (from your first page) :
"easiest way to trade when direction is known is to enter when price crosses the opening of D TF candle. Hold for about 40 pips."
Which daily candle, today’s, or yesterdays?
would this be on reversal days as well?
What happens when there is no reversal, how do you enter if you are following your rule which states “buy if yesterday was a buy” ?
Its todays opening candle. This applies especially when market has made a turn and is strongly moving on one direction with no immediate support or resistance areas nearby. SL would naturally be yesterdays candle opening.
That was until some thought me how they trade. They place a pending order on the 50% of yesterdays candle. This way their drawdowns are minimal.
I look for smaller time frame Support and Resistance and take the bounce there.
Direction = D TF.
Entry, SL S & R area are H1 and H4 charts.
When there are no reversals I buy according to the prevalent bias. if its up, than I look for buys only, if its heading down, than I look for sells only. D TF is just for direction.
Hello everyone,
I’m very new to forex trading and babypips has been an amazing resource. This thread in particular is teaching me so much. Thank you Nikitafx for taking the time to answer questions and explain things in simple terms.
As much as I learn the mechanics of support, resistance, bias and entries, as soon as I open a trade I am glued to the screen staring at each pip movement wondering if I should be changing something haha. It’s such a psychological thing.
That being said, I think that entries are the most important part of a trade. A proper entry should see you into positive pips within the first 30mins. I think a lot of the stress for me is because even though I predict the direction somewhat correctly, I enter too early and am nervously watching the ups and downs before it eventually moves my way. I am now aiming for only about 10 pips per trade. Does that make me a scalper? (is that bad?) I just want to learn to make positive trades consistently.
I want thank everyone on this thread and tell other newbies on the forum to not get discouraged, but continue learning!
Profit is profit, regardless the amount.
But we have to keep in mind of our losses too.
Its best to have atleast a SL to TP ratio of 1 : 1.5. This way, even if your entries are 50% profitable, you will still be making money and see your account growing. 30 pips SL means a TP of atleast 45 pips.
A SL to TP ratio of 1:2 is very achievable. 1:3 is considered par. 1:4 and above are not trades that come often if you are just starting out as a trader.
So keep this in mind. 10 pips of profit is fine, but what is your winning ratio like?
Money management is very very important in trading. Its as important as picking the right entry. Statistics will give you an enormous edge.
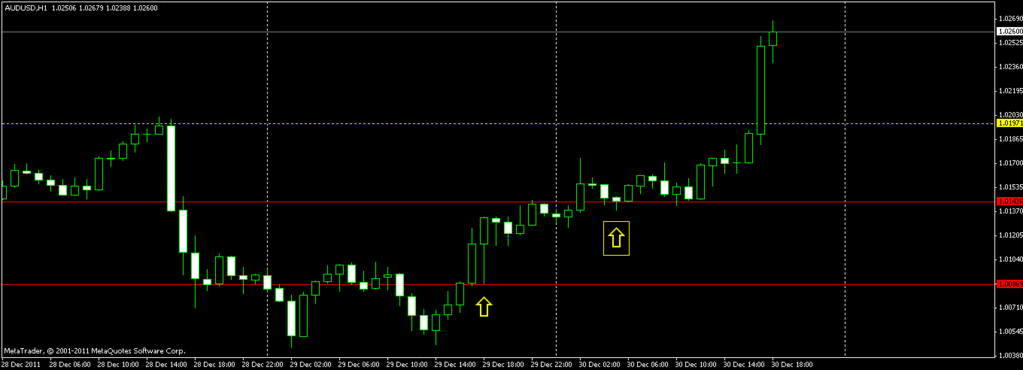
AU H1
Piptronix, here is a cherry picked chart for your question regarding waiting for confirmation candle on D TF.
H1 chart shows a turn around. First arrow marks possible entry. Note how we always wait for resistance to broken and retested. The entry should be on the retest, as this will give us quickest profit and smallest SL.
Second entry is again previous support which was broken three days ago. This line was than broken from below and retested. Second arrow marks possible entry.
Always look for this sort of BPC ( breakout, pullback, continuation pattern )
I hope this explains further your question. This is how we use H1 and even H4 charts to pick entry without waiting for confirmation candle.
I hope I’m not jumping in the middle here, but I have a question about this chart. How did you know the broken resistance turned to support right before the first entry was not valid? (I think at 29 Dec 08:00)
Also, you would enter at the end of the arrowed candle right, and keep the SL at the close of the most recent swing low. So for the first entry it would be around 1.00545(about 32 pips) and the for the second one somewhere around 1.0132(about 12 pips).
I understand what you mean about knowing your SL-TP ratio and not just how many pips you want to make. I’ll be honest though, I’m doing a very newbie mistake by not setting an SL in software because price tends to fluctuate 10 pips back and forth quickly and I don’t want to get stopped out.
Hmm, just writing this out is making me realise something. The trades I’m making, if I had to calculate what the SL-TP ratio would be if I actually set the stop loss…it would at best only be 1:1 since I am preparing myself for 10 pips in opposite direction before I take profit on 10 pips in my direction… so not very good trades at all haha…
Sorry for all the questions, and thanks for the guidance!
AU H4
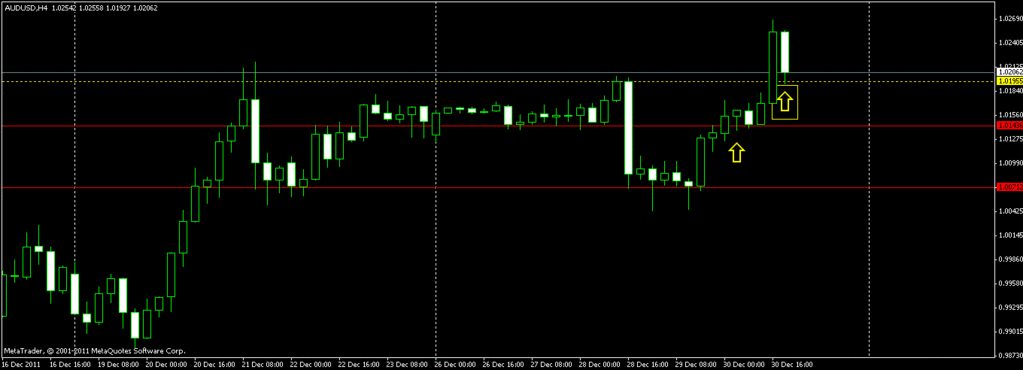
Your entries are valid. Though I would stick with areas that prices have recently bounced off on.
The chart above shows the H4 snapshot and why I picked the support and resistance line that I did, and not on a lower price as you pointed out.
The more TFs that show price action on a particular support and area line, the stronger and more valid it is.
Finally, if we were to look for a lower and earlier entry, than the bottom red line is a clear support area as prices not only bounced off the previous low, it also shows classic candlestick patterns for us to take the trade.
On the part of your 10 pip entry and SL, your winning ratio has to be 60% or higher in order for this to work. furthermore, as you are fully aware, even if you take entries on min5, you would rarely get SLs as small as 10 pips.
Mark your support and resistance on H4. The prices will always make its best effort to go from one level to the other. Your TP can be set accordingly. It will hit. Being jittery is not a good habit that should be encouraged.
I think I missed out on a question of yours.
AU H1
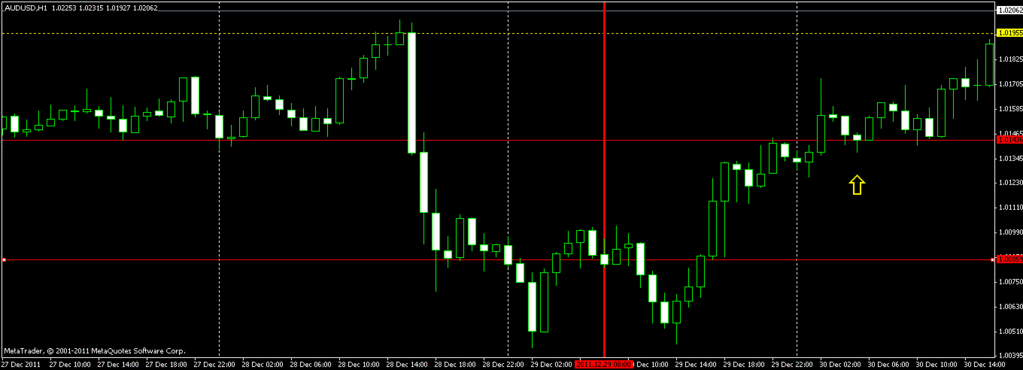
I hope the cross-hair marks the candle you mentioned. Which would than take us to H4 chart for further analysis before pulling the trigger.
Why wouldnt I buy on the very very first attempt of a bounce right before the vertical line marking the period separator? Because daily candle at that time was about to close as a bear candle. I would have ideally looked for a sell at that period in time.
AU H4
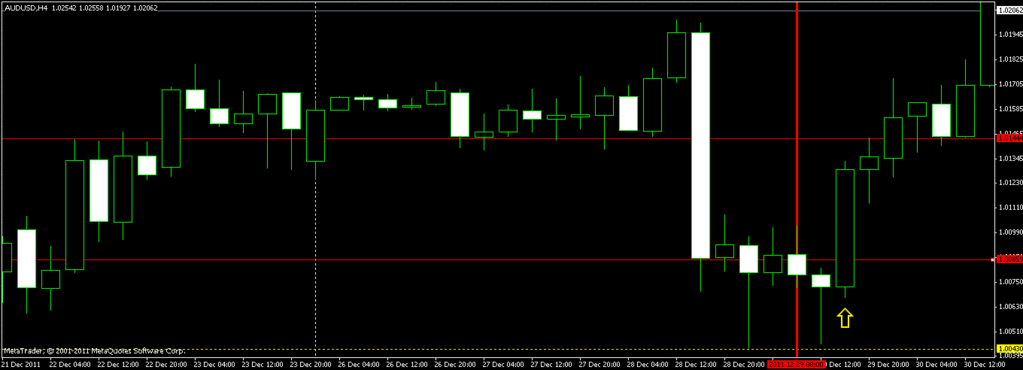
The only logical SL would be right at the bottom of the first pullback candle. Again the cross-hair marks where the entry would have been on a H1 chart. In this case, it came within a pip or two from being hit.
In actual trading, my entry on H4 would have been at 1.00782, just as the H4 candle begins, and my TP would have been at the upper red line, marking the previous support area which did not hold. SL would have been 33 pips, TP about 60+ pips.
AU H1
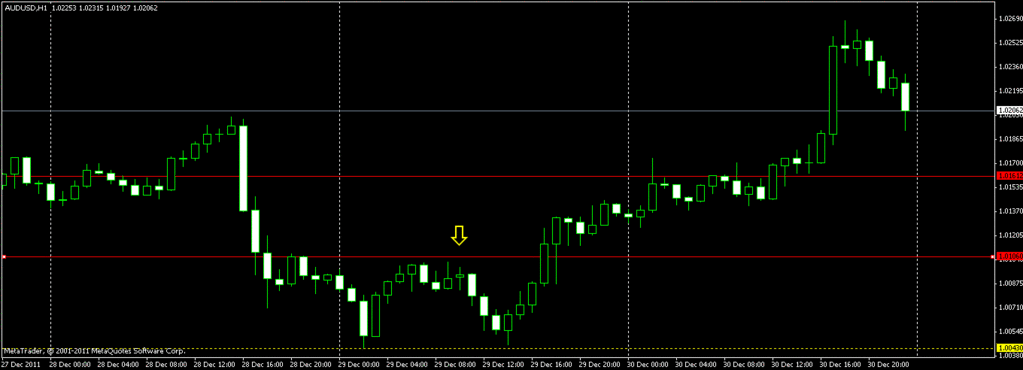
Finally, if yesterday was a sell and today will be a sell.
This would have been the set up. The H1 candle being marked with an arrow would be the candle indicating price has stalled and expect it to continue with bias.
If we had entered right after the next candle opening, SL would be about 12 pips and TP would be about 40 pips, right at the bottom of the previous lower low ( LL ). That would be a healthy 1 :4 risk to reward ratio.
So there you go. There are more than one way to look at the market, and there are more than one way to trade the same method. What is important is the risk to return we are taking is worth it and valid.
The support and resistance areas are just places we should be watching out for price action to form. Not predict where market is going in the middle of a move.
Wow those answers make so much sense. Thanks!
I completely forgot to look at H4 again to confirm price action. I only checked H4 at the beginning when I sat down to mark support and resistance and then only focused on price action in H1. “The more TFs that show price action on a particular support and area line, the stronger and more valid it is.” - understood.
I noticed my charts look different than yours, then I remembered previous posts about the Sunday candle. Sure enough, my MT4 has 6 D1 candles a week - wacky. I’ll try to open a demo account on some other broker with proper charts.
Too bad it’s weekend, can’t wait to try this out haha. Happy new year!
