If you look at the green lines on the H1 and H4 those are S&R lines that I drew 2 months ago. It seems to me that the lines are somewhat being “respected” quite a high number of times as evidenced in the screenshot and going all the way back.
My theory back then(which I seem to have ignored and noticed again this last 2 days) is that the strongest S&R indicator would be on the highest TF. I.e. the higher the TF the stronger the S&R lines. Thus I began meticulously drawing a line on EVERY H and L of an OHLC candle on the M TF. I have a 27 inch monitor(iMac) so I can zoom in to the max and ensure that my line touches the end of the candle’s wick.
What I realised, as mentioned, is that they are tested many times and being S&R lines based on the M TF they are fairly strong S&R lines. I didn’t know how to use them or interpret them correctly back then thus I ignored them. However after reading your latest postings on how you draw the S&R lines and use the BPC technique to enter into a trade I looked at my screen with the M TF S&R lines and they seem like very good candidates for making entries into trades.
Do you think I am on a wild goose chase or is there something here?
Off topic, you mentioned you were testing a new strategy that will yield a very small SL for entries, how is that going?
Regarding the candle wicks as your areas of support and resistance. I personally find candle opening and closing as much more accurate. Some go for the wicks. Again its not an exact science.
On the other hand, I find end of wicks as a very good place to put a SL on. Not only are they great to put SLs on, putting a pending order 10 or 15 pips below the previous wick that got pushed from S & R areas seem to work well also.
You are spot on regarding the relationship between S @ R strength and TF. The higher the TF, the stronger it is. But do not ignore the smaller TF as candle formations that indicate a reversal, continuation etc etc form on H1 and H4.
Final part, I find myself on a different predicament that you are in. My higher TFs have the least number of lines. I usually only draw lines on the immediate S & R around the D TF and than work myself down. SO on the H4 TF, I might have the two lines that I drew on D TF but than I can see another area where I draw another S & R line. Finally zooming to H1, I might have to add another line, making it a total of 4 at most extreme cases for me to watch for candlestick patterns.
I notice that you have the opposite dilemma. Your D TF seems to be the one with the most lines, and as we go into smaller TFs your S & R lines seem to become fewer and fewer.
I would suggest that you try to keep the lines to the absolute minimum so that you can have a better understanding of where the price is going to go. Also, concentrate on price action and Support and Resistance areas on the waves that are in the immediate preceding area, in other words, closest S&R areas and not worry about formations that have happened far away from where the price is at the moment.
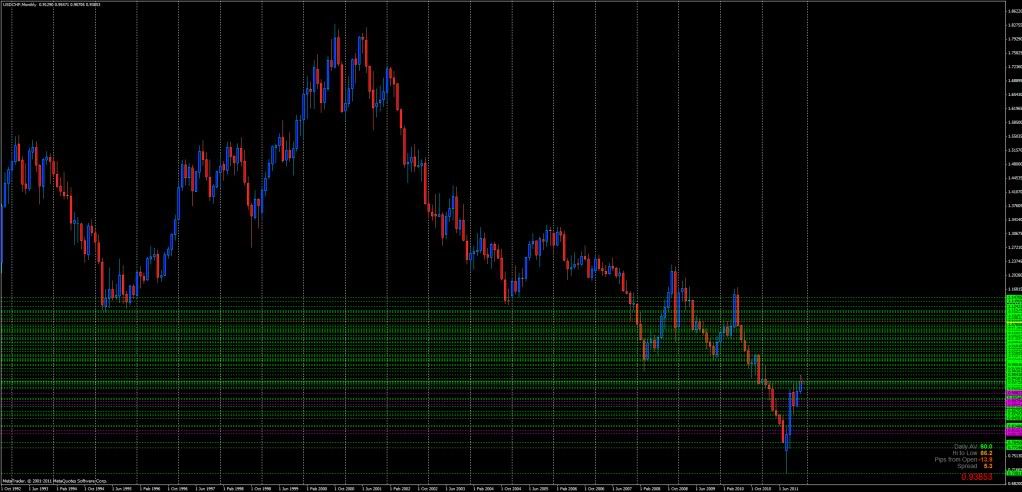
I would only draw two lines on this D TF chart. The top most red line and the bottom red line. The middle one is actually from the one I drew on the H4 chart.
So ignore the middle one for the moment. So we can clearly see where is the support, at the bottom and where is the resistance, at the top. Price is in the middle now and we cannot speculate where it will go.
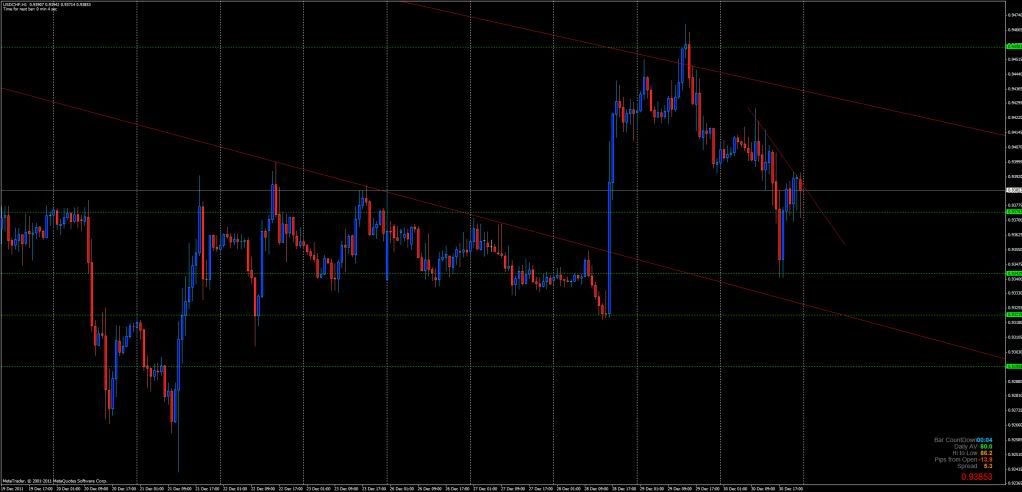
Now the two lines on the extreme top and bottom came from the D TF chart. But I can see a S & R area in the middle. I can only do a rough line as I am not really sure where exactly this area is cause of all the holiday period market noise.
We can see a good pullback candle on the H4 chart. This would be a classical BPC pattern that can be traded provided that it was not the holiday and weekend break in between. Market sentiments can be tough on a fresh week. Mondays can always go the other way around, so can Fridays.
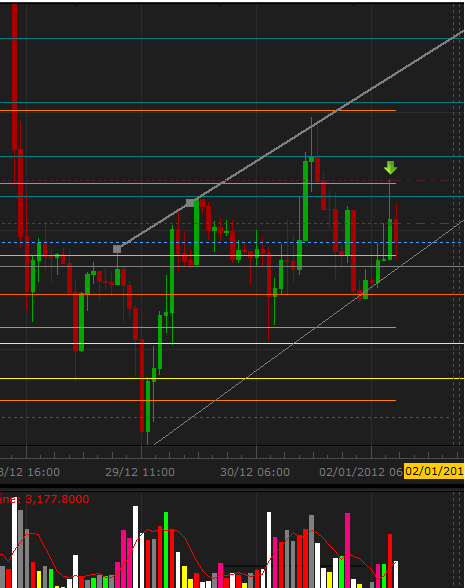
Since we cannot make up our minds we zoom into H1 chart.
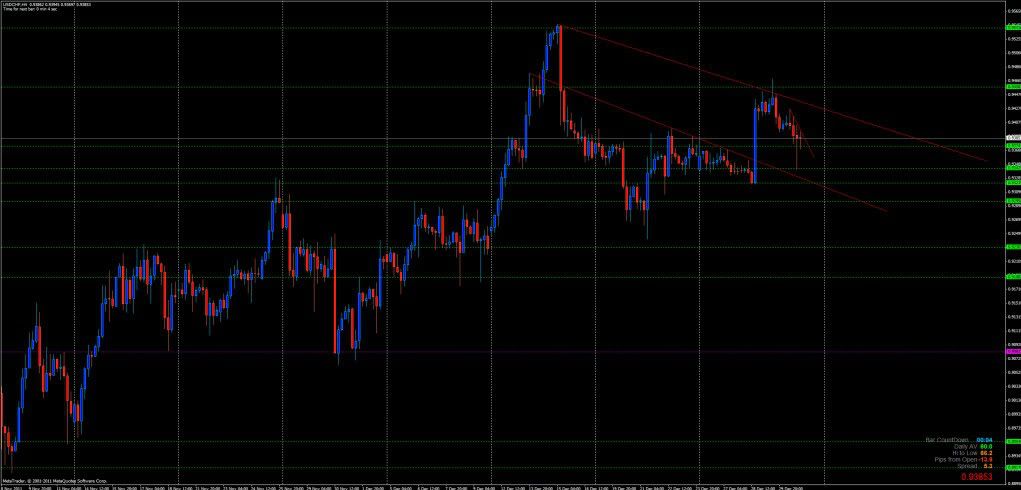
Now we can only see the two lines but not the third which is higher up. The yellow lines are now areas where I have marked for a possible buy and a possible TP area above the buy. I would look into H1 for an entry because the H4 candle only offers me a 50 ++ pip SL and its too high for my MM and risk %.
But the most important thing I wanted to highlight with these three charts is how my lines actually become more as my TF becomes smaller.
And as for your final question, I am very happy with the new thing that I am doing with this method. The SLs are really really small. I just need a little bit more time in order to see if its something that can really be traded or its just one of those things where the market is doing at the moment but changes later on.
[I]“But do not ignore the smaller TF as candle formations that indicate a reversal, continuation etc etc form on H1 and H4.”[/I]
That is very true as reversals can be spotted earlier on the lower TFs. I feel that there might be something here so I’ll test it on my demo account. I’ve also bought a backtesting tool and will backtest it on my MT4 platform.
By the way I ended my 1st month of live trading up 2.37%!!! Was down 25% at one stage and managed to claw it all back. Used your commie rule to a T and made it. I just need to tune my entries and not overtrade.
Happy New Year to you and everyone else on this forum!!!:35:
I too believe the less indicators used the better due to lag and I’m starting to use price action, trends, S&R etc to trade. Going to have to catch up with this thread and the VSA thread lol
E/U 1hr looks like a Head and Shoulders formation?
I’ve learnt about pennant, head and shoulders and the likes almost 2 years ago and till today I find it a hit and miss affair. Don’t get me wrong here, I am not saying that they are not good it is just that my personal experience(and I am a newbie by the way) is that the results are like flipping a coin.
It could be that I am not as proficient as you or other people that notices these stuff and it could be just me but that’s my thoughts on the head and shoulders and the likes.
What I can say with more certainty is that this PPA method from Nikita works! First time ever I’ve traded live and made a gain in 1 month of trading. Take your time reading this thread and post your questions and comments here. The folks in this forum are uber friendly and helpful and I am sure you will feel right at home here.
Hi, I am using(or at least am still waiting to use it) Simple Forex Tester. Google it it’s fairly easy to find. There are many testing tools out there but this is the only one it seems that allow you to back test your manual trading in MT4.
Only prob is that I’ve not been able to use it yet as I’m facing some issues with the registration part(even though I’ve paid for it). The guy it seems is on a holiday still and have not answered my email. Oh well…
Very slow movement for the start of the week. I get that people are still probably on holiday time and not everybody is as eager to jump back into the trades as others are, but prices haven’t seemed to move hardly at all today.
Hi Going Downhill
Nice trade, 80 pips very good.
When I entered the Market I try to follow the method of having 1:1.5 or 1:2 R:R,
Suppose 20 pips is SL then take profit will be 30 to 40 pips.
But according to the method when you entered the Market look for the support or resistance to TP.
If Market is bearish like today then look for the nearest support to take profit. If you are confident that Market will go down further you can take 70% of the trade at nearest support and run the rest of them to major support.
I could not find much today in the way of previous daily or session highs and lows that would offer much support so I relied on pivots today. I set stops to break even on S1 pivot and closed out when it appeared to stall at S2 pivot.
What you have done is very good, yes we can also follow the daily pivot for the support and resistance. I was following the pivot as well today and keep in mind about the R:R which also very important.
hi niki and guys! … a question to you niki… ahm, you mentioned before that you use fx primus platform in reading charts… i downloaded their mt4 and it was showing a sunday candle… is it necessary to have an account with them in order to get the kind of platform that you’re using? also i downloaded fxcm tradestation and theirs is not showing a sunday daily candle… is that ok to use? by the way i already went live last monday, and boy it was stressssfffuuull! my losses outweigh my winning trades… so im reading this thread again… thanks in advance for your help niki!
Everybody has losing trades and sometimes the number of losing trades to winning trades may be about even or more than your winning trades. The key to staying profitable is to wait for a reversal pattern in the direction of the daily trend to show itself and then place your order. This will give an extremely tight stop if at a support/resistance level. The stop should be just above the high which can be 10 pips or less if done at the right time. Entering at a s&r level should allow for a risk to reward of at least 1:2, but it wouldn’t be uncommon to achieve 1:3 or higher doing this. To achieve better than break even with a 1:3 risk/reward, you only need about 40% winning trades. So if you have several trades stopped out but are only losing 5-10 pips each, then it only takes a couple winning trades of 30-40 each to make it. The better you get at seeing the reversals and placing tight stops the more successful trades you will encounter giving you a higher pop count at the end of the week.
Regarding the Sunday candle. It will affect you analysis for tuesdays bias. Sometimes lets say price went up on the sunday candle. Then went down for monday but did not go below the low of the sunday candle. This means Mondays real candle should have been an up candle but is instead showing a down candle. Also lets say friday was a down candle. Now on monday you will be trading an up day instead of a down day because of sunday now being thrown in there. One thing you can do do fix it on most plattforms is set your daily candle to close at 1700 est (NY). That will fix it on most plattforms.
thanks for your advise forexpastor. I wasnt very patient enough in my trades that even if Ibias was on my side I got out early or etered too late that igot stoppdout… and the worst part is mybroker doesnt let me trade using 1 lot coz I only have 100 on my account. the minimum I could trade is 5k and thats pretty big for starters like me and big for my account… I dont want to add fund on my account just to be able to trade on 1 lot… so my account is almost haf theamount even If I only traded for 2 days… bummer huh? now my goal is to get it back up… cross-fingers… :33: