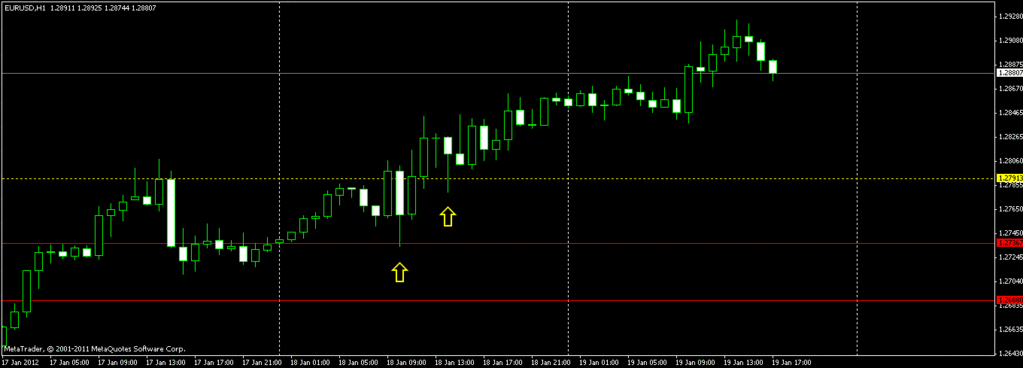
good morning niki and members of this forum!  niki id like to know your thoughts on eur/usd yesterday… it was acting very strange. got stopped out alot! i almost drain my account…
  also my broker increased the spread… weird… i think i won’t be trading live for months! shheeessshh! ahm… i don’t know how to post pic, i tried tinypic but it always says invalid url… thank you in advance
here it is… i hope this works…
you see the bullish engulfing candles always followed by bearish candles… i can’t seemed to understand why if we follow candlestick pattern… emphasis on candles between red lines… thank you on your thoughts on this…
Candle formations are impotant. Whats more important is daily bias. What was bias so far everyday this week? Not beariish thats for sure. If you would have gone with bias I see plenty of opportunity to collect profit on that chart…
Hi everyone!
I would like to thank Nikita and all the other’s that have contributed to this great thread, both with great questions, and great answers 
I was here on this thread before, left around the 50 page mark, have been reading up the two past days to catch up again, now it’s time to hit the market!
Will be looking at D TF for my StockTrak portfolio assignment for my college class, and H1 for my FXCM demo account.
Good luck all, happy pipping!
Does anyone following this method use fundamentals in their analysis? I mean, if your trade is supported by fundam. this would give you higher % rate of success and would allow for a higher Risk/Reward set up, right?
hello bobmaninc… yes you are right bias was bullish… but as i said earlier emphasis on the candles between the red lines…when i saw that first bullish candle i entered long right below that red line on top and sl on that second red line… but apparently got stopped out… it was clear to me that it should be bullish… tsk… after i got stopped out i stayed longer just to observe this… then i zoomed in to 5 minutes then there was a big gap up on that 3 bullish candle… super super strange i say… i think this is one of those times that you just can’t understand what those big players are tring to do… imho… hehehe! nways thanks again for your reply bobmaninc… 
gaps might not always be big money making moves but also widening of spreads as you stated happened for you. Also I am not sure where in the red lines you are refering to. The first time price tested it there was some bearish candles I always like to see a 50% retrace of the long wick. And price responded and went down. You could have got out alive with trailing stops there. However Not in direction of bias so I would have stayded out. The second time it went in there. I see nothing saying bearish to me. Also you clearly marked a nice support line to pay attention to. That along with bias would have made me think long not short.
hi niki! i know this is super late question… but im actually trying to digest every trade you took since i already traded using live account… my question why did you enter on the candle marked with yellow arrow? i see that it is a bullish candle… did you enter short because it is showing lower high and lower low? thank you again… 
aww… ok… seems strange to me coz it was a big gap on 5 min tf… i see… i actually checked 5 min tf for entry and also found a nice support represented by that long blue line on 5 min tf… so placed my sl a bit lower than that blue line… i guess i really need more practice… hehe! i was actually bullish on this pair but got really frustrated when it was showing that bearish candle that hit my sl… thanks always for your input bobmaninc… 
Hey nikita,
-
what do you mean by “that particular order” for the correlations?
-
How would you then identify which pair to trade if the correlations are correct then?
I was choosing between EU and GU for the trade today and the charts at the point of entry are as follows:
GU 1H
EU 1H
My entry point (buy) is in yellow and the purple line is my stop loss. I lost the trade after a while in GU when prices very nicely hit my stop loss and rebounded. According to the charts, GU EU and UCHF were showing a buy bias on the D TF. Did i do anything wrongly in the trade?
Also, How would you have identified whether to trade EU or GU in this instance? GU went about a ranging consolidation around my entry point a few hours later whereas EU shot up around 40pips.
Thanks!
-
EU and GU Correlate well and AU and NU correlate well.
-
There are 2 ways to do this one is if you in an uptrend and EU fials to make a higher high but the GU does make a higher high. Then you can expect the GU to drop pretty hard. Just make sure this lines up with S/R levels and whatnot.
The other way you can do this is to look at the USDX to see what it is doing. Keep in mind it moves in the opposite direction than these pairs. Mean If EU failed to make HH but the GU did check the USDX to see if it made a LL if it did not then you might look to short the EU if it did you should go long the GU. Hope this helps. I am not the best at explaining things but I will do my best.
ahm whats usdx bobmaninc? sorry for being too naive…
USDX= US Dollar index
If you are using MT4 open your market watch window. Right click on market watch. Select add then scroll down toward the bottom and you will find the USDX. Most MT4 brokers carry it.
USDX works well for a guide to what other currencies should be doing. If USDX is going down EU GU AU NU should be going up. If one of them is not and there is no reason such as new release to explain it chances are thats the currency you should be looking for a long entry on. Dont use it for an entry signal just a guide for the best pair to trade. Once you get an understanding for how this works you will also get an understanding as to why nikita states if yesterday was a buy you should be looking for the pair to make a LL to go long.
EU H1

We must first decide on direction first on D TF.
Than we look for our BPC ( Breakout, Pullback, Continuation ) signals. Those two arrows mark candles that show BPC. The wicks of those candles is where you would look for SLs.
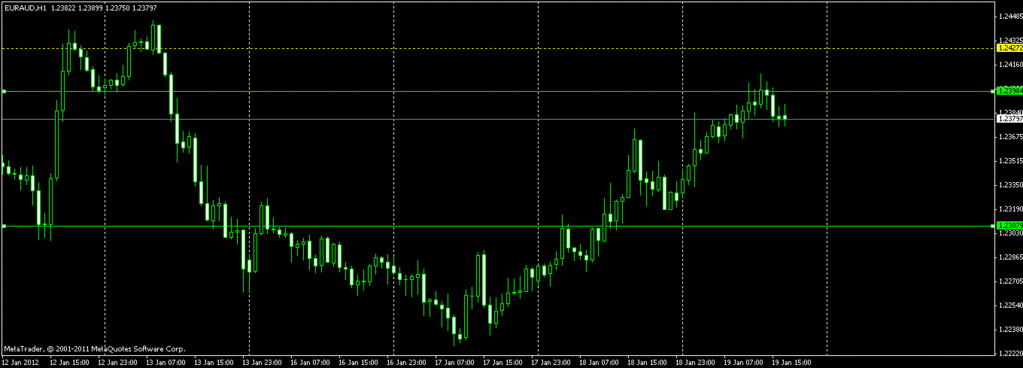
Look out for BPC formations. I missed a 100 pip move on Euro Aussie today because it did not hit my pending buy by 12 pips.
EA H1
The green bottom line was where I had my pending buy, the Green top line was my TP. We wait for price to break upwards, than wait for a pullback before entering a buy.
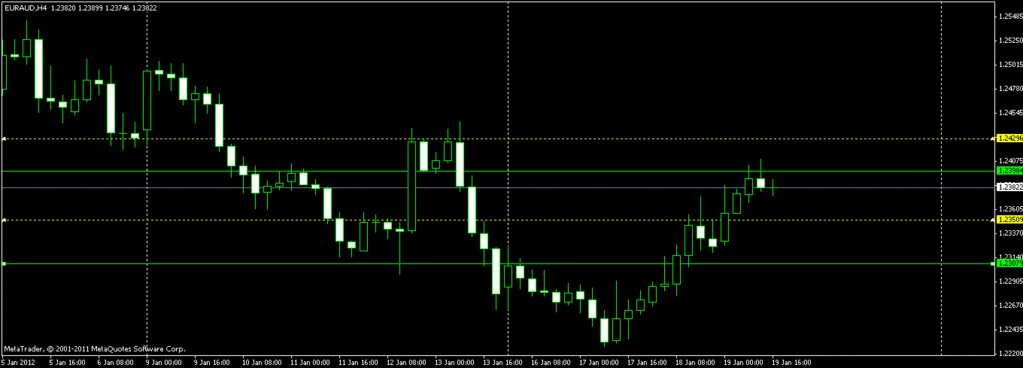
EA H4

The solid green lines mark where my pending and TP was for today. I wont buy now as its now considered buying retail. We want to buy at wholesale prices. Big players buy at wholesale prices.
So if I am to look for another buy, I would wait for a retrace and buy at the middle dotted yellow line and my TP would be the upper yellow line. The middle and upper dotted lines are previous S & R areas on H4 TF, just like how the Green solid lines were S & R lines.
The game keeps repeating itself again and again.
We just need to stop looking at it in a very complicated way.
Read how price moves.
Watch how it jumps up from one level and punches through above the next level. ( or jumps down ). Than watch how it falls back to the level that it punched through and it bounces off that level, to punch upwards again to break over the next level. It keeps repeating the same action again and again.
It happens again and again and again. Do not complicate it. Its just like a bouncing tennis ball.
The name of the game is called Technical Trading.
Pure and pure price chart trading. Economic fundamentals influence long term currency movement. It matters little to a person who is playing a 30 pip SL as his maximum risk.
I took the trade because higher TF showed a strong down movement. Otherwise I would have waited for the price to retrace upwards.
As far as the bullish candle is concerned, I realised sometime back that my SL was bigger because I was selling as the bearish candle forms and breaks downwards from the range, as you can see in my earlier day trading as pictured above.
The trick is to sell at a much higher price so that our SL can truly be small. Like my UCHF trade two days ago. I sold after a strong bull candle.
Remember, there is only S & R areas and candle patterns mean something only when they form at these areas. The rest is just noise or smaller TF whiplashes.
Sell high, buy Low. How to sell high? After a strong bull candle making a Daily High ofcause. Same as buying low. How do we buy low? After a strong down push ofcause.
Always remember, big players dont look at candles. They are just looking at price levels. Wholesale prices. That is why we see long pullback candles exactly at previous S & R areas. There are orders there that would make us consider retiring. That is why the sharp pullback. That is why its a safe SL area.
Read the charts. Read the charts.
Thanks bob that really cleared stuff up.
I can’t seem to locate the USDX on my MT4 Platform. Im currently using Oanda’s. Anyone has any idea which platform has the USDX?
Also I might be jumping the gun, but what if I was looking at the Yen instead? Is there such a thing as a Yen Index?
No not that I am aware of. But USD/JPY will correlate with USDX. All the USDX is a mesure of the strength of the USD. So if USD comes first in the pair Like USD/JPY. Then as the USDX goes up so should USD/JPY. And I have already explained EU so I wont repeat that. I will get back to you on getting the USDX on MT4 as I typed that earlier I thought I was missing a step. Give me a sec let me see if I can remember or later when I get home I will look it up on my MT4 and let you know how I did it. I know Oanda has it
Thanks!
I really wouldn’t know what would have happened to me if I didn’t stumble into this thread and met you guys. You’re all great help!!
Very nice explanation thanks to Nikitafx and bobmaninc
Ok I was close to getting it right off the top of my head. To get USDX you must open the market watch window. Then right click symbols (top left of the window) then select symbol. Then you scroll torward the bottom and you will find USDX click on it then select show. Once thats done it will show in the market watch window. Hope this works this time.
Also for fun there is an indicator for MT4 where you can display all the charts on one chart to spot correlation between them. It can be usefull but please please please do not use it as a signal to enter a trade using this strategy. If you do you will pay for it. I have strategies that use this as part of a signal but not this one. For this one it works great as a guide to pick the best pair to trade and to time an entry. Nothing more.
Now I will go out and say I dont fallow this strat to the letter of the law. As I had a sarat inplace long before this thread. But they are very very close. It works today I fouund the downside to using this strategy as I just filed my 2011 taxes. I got a nice hit on my tax return. Thats cool because I know one thing here in the USA if you are paying taxes that means you are making money. So a nice tax hit means nice profits. So I will not complain. I will take it as a lesson learned and add it to money management for this tax year. I was hoping for a nice return this year to add a few more monitors to my trading lab (2 38" flat screens:p) and I still will but it will come out of my yearly profits from my trading account. The good part is I can write them off as a business expense next year. This way I can watch my EU GU on the 2 screens I got now and my beloved AU NU on the flat screens and have USDX and various stocks and gold oil all that on my lap top. Looks to be a good year heading my way.
Lastly for all those in the USA that think you will dodge uncle sam on taxes in forex. Bad idea. I was talking to a buddy I got that works for a market maker or something out in California. He told me if you trade with a market maker and make money. If they took the other side of your trade and lost(you made money) they can write that off as a loss on there taxes. Witch means you gains were reported to the IRS already.
I will quit rambling now as I have had a few drinks. I made a nasty typo on another account today setting up a trade on the S&P 500. I made a typo and instead of risking 1% I got stopped at 10%. That account is a IRA account with quite alot of money in it. So that stings but I will live not quite a minor setback but not a major set back either. That is the only problem with using different charting software than what you trade with. If you make a mistake you dont see it on your chart. Where if you did you would know something was wrong. You live I would say I learned but no I will probably do it again someday but I will fight again another day.
