I totally got whipped on Friday. I was looking at shorts but the market totally went bullish instead. Can anyone comment on any telltale signs of an upwards bias on friday? Thanks
I think it it because the major pairs against USD is in term of a down term for so long, and it might have some correction on some potentiall turning point.
Hi which pair you traded, if you see on GU and EU pair bias was bullish for Friday because Thursday close as bullish, according to the method we need to see the previous day candle like if yesterday was buy we buy today when price retrace to a significant price level such as support.
trading on just price action is good but you have to have confirmation that the price action will keep going in that direction to fulfill your curiosity or your gut will make you lose
Would you like to share with us why you were looking for shorts?
GU, EU, AU and everything else with a USD at the back was bullish for Thursday ending. So if we were to follow my blind way of trading, than we would have ideally looked for only buys.
We would have looked for buys at where yesterdays resistance was.
Yesterday bullish, so today ideally look for bull. Yesterdays resistance broken upwards, becomes todays support. Support is where we would buy so that our SL would be as small as it can be. The concept of BPC.
I think you need to reread the thread again, slowly.
Figure each one out first before going to the next concept or idea.
I have been trading profitable for years averaging 40 pips I have tried every indicator but now I only have macd and 3 moving averages on my charts, but trades are based on price. good job on the post.
I must second Nikita here along with sharebazar. I going to assume you traded the EU so I will stick with that pair. Thursday was a bullish day that bounced off support. There was no indication at all saying price will reverse to the down side. Here is a daily chart of the EU
Note the bottom red line price has tested this area quite a few time in the past. Thursday price hit it and bounced up. There is nothing comming into friday indicating a reversal. I dont trade Fridays due to alot of profit taking heading into the weekend and things can get shacky but if I did I would have looked to go long.
Here is the 1hr of the EU
You can see here price went down to the support line and formed a hammer (left circle)indicating price is most likely going north heading into thursday. I would not have traded that hammer for the simple fact it was against Wendsdays bias and the Wendsday candle showed no signs that price was going to respect that support level. So I would have looked short on going into Thursday and most likely would have been stopped out. But since price did respect that level and closed Thursday as a bullish candle. You now look for a long and to be honest based on the 1hr I only see I possible entry (second red circle). witch price pulled back to retest a support level from earlier in the week and formed a fractal low. Even that entry would have been shady at best IMO even though it would have worked out I would have sat out (wait I did sit out lol).
My advise to you is to slow down go back to the basics. Daily bias, Pull back to retest a S/R level on the 1hr, and candle formation signaling an entry. That basic principle is so important. If you dont see and entry on this you dont enter. If price on the daily chart is showing a reversal candle on a s/r level take the next day off and play some online poker or what ever you like to do and wait for the dust to settle. I have posted some trades going against daily bias on here witch maybe I should refrain from that a little. But my signals were very clear and I kept risk as low I possibly could due to the fact it was against bias. This is where you should sit out untill you understand market structure better (witch will come). There was nothing saying price would reverse or any s/r level to slow price down comming into friday so bias was very clear to be bullish. Honestly though Friday was a take a long weekend day for reasons I wont get into other than overall momentum on the daily is down (probably why you looked to go short). I find those days not of the highest probability so I choose to pass on them and wait for the market to tell me to short again (witch was not friday or monday comming up). Hope this helps always go with bias or sit out. Or you get what you got and the market will spank you .
Very good explanation
Its important that those who are trying to learn to trade watch the market as often as they can.
Pay attention to how a candle forms. Pay attention to how it goes up or down and how that correlates to a higher TF candle.
The way price moves is exactly the same on all TFs. bouncing off levels and breaking through existing levels.
Watch how a Daily candle forms, starting from the candle opening to how it ends up closing.
There is tonnes of lessons and ideas to be gleaned off that formation process.
You will than know where and why price decides to make a LL or HH compared to the previous day etc etc.
I agree with Nikitafx another great tool a new trader could use to watch how candles form and the emotions that you may feel as they are forming is think or swim or ninja trader you can replay data from a previous date the further away the better that way you don’t really remember what happened that day and trade it in a sim mode this is great for the weekends when the markets are closed and for traders that have full time jobs and want to become full time traders. I have been profitable for years and still use it on the weekends or when I have down time to keep my skills sharp.
FXmike where in Florida are you I am in Jacksonville florida.
Bradenton/Saraota area.
Ahh Thanks for pointing the areas out. I think I had too narrow a view on the markets and focused too much on the 4H charts while forgetting to look at the dailies and resistance levels at the dailies.
I’ll go back and re-read the thread again.
On the topic of BPC, I would like to clarify it a little to make it clearer to me.
Do you guys view the white circles as a valid pullback? or rather, just the orange ones?
The week has just started and I am just going through the charts.
I am very cautious on a Monday. Just like Fridays, it can get a little unpredictable at times.
Usually, at the beginning of each week, I will try to look at the charts and see if I can see where it is all eventually going to end up.
Most of the time, the picture will not emerge until Tuesday or even Wednesday.
This is where I believe my edge lies in the fact that I dont simply trade price action on every formation but pick and choose. That is why I have other layers like Bias and the Communist way of doing things. This is what makes the difference between a profit and a loss at the end of the week in my trading.
I have said this through out this thread. And I am going to repeat it many times over. If you are not sure what its doing or what its going to do, stay out of the market. There will always be another opportunity later. Its easier said than done. But its absolutely imperative that you do not break this rule. Do this, and your gains will be very high.
Filter the trades. Especially when market is range bound on a higher TF. Do not guess on Break Outs.
So this is one of the things that I do. I scan all TFs. These days I go up to monthly TF. Than I glance through Weekly, Daily and H4. I than mark the obvious Immediate S&R areas on either Monthly or Weekly. Once that is done, I than proceed to see what price might do at that levels. The pairs that show me a clean, clear cut, obvious move, is than moved to the left side of my MT4 platform. Those pairs which I cannot read at all goes to the extreme right.
This is so that I know what are the pairs I need to spend time paying attention to. I do this at the beginning of each trading day.
Aussie USD is one of those pairs that is sitting on the left side of my Terminal today.
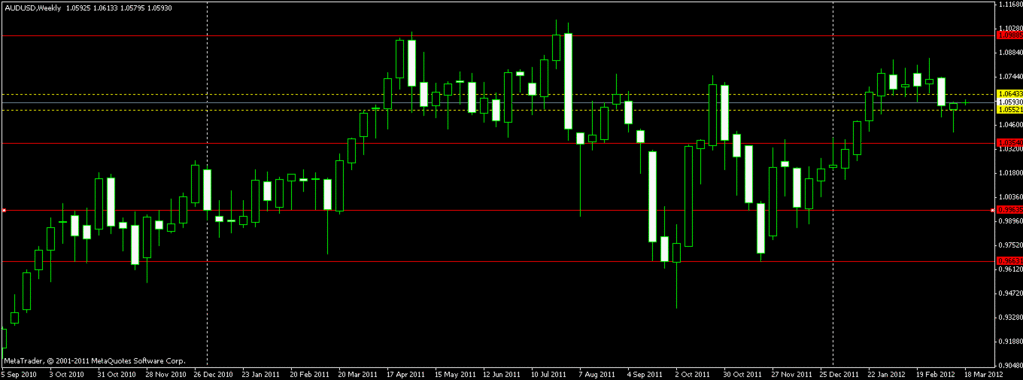
AU W TF
So we see that weekly has got some sort of a pullback candle. So that means, there is a chance for the price to climb higher this week. Than I proceed to D TF.
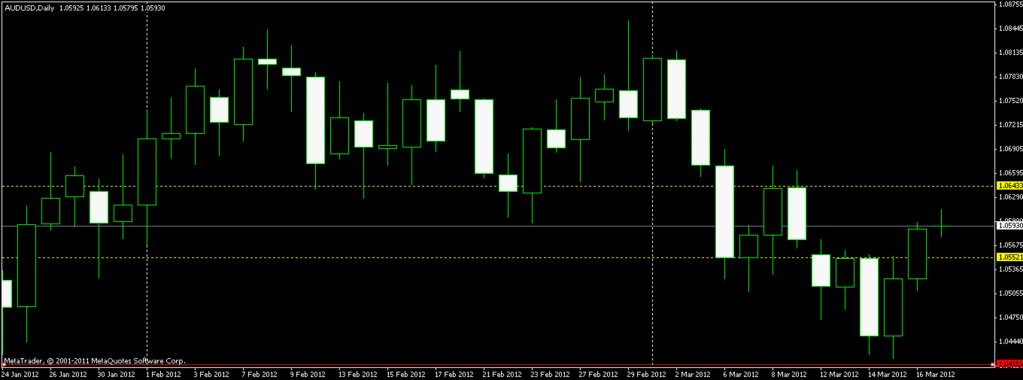
AU D TF
Here, I mark the nearest current S&R levels with the yellow dotted lines, so I can than know which is the Higher TF S & R area when I am in the lower TFs. If we look at the left side of the chart, we see another reversal that happened sometime back. That area acted as a support and prices today opened at or below that area.
So, what that means is I wont be buying now because most probably prices will be rejected at the current level and it will be pushed down. But than, Friday was a healthy bull candle. Which means that, today, I should be looking at a buy, rather than guess on a bounce at this level and take a sell position.
I than proceed to the H4 TF to look at what my trade plan is going to be. This is very very important. You should not be guessing if you are going to buy or sell the moment you look at your charts. This is how you keep your emotions in check and learn how to wait for your entry. You plan your trade earlier. Look at a few pairs. Rearrange your charts. Prepare for the weeks trading hours before actually taking a trade.
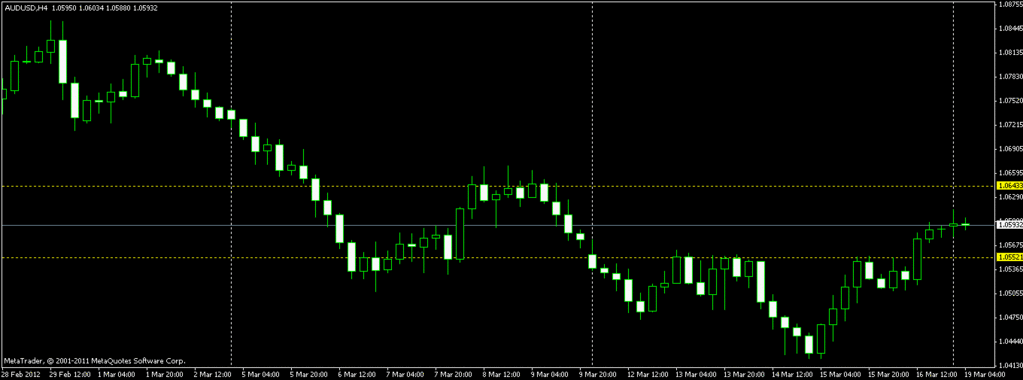
AU H4 TF
H4 shows that price has stalled in the last two candles. Chances are now that it will do a pullback. But this is where you should be careful on Mondays and Fridays. For all you know, the two candles that are showing price has lost momentum could really be because of the traders getting ready to close for the weekend and not really the underlying sentiments of the price of the pair itself.
So I can clearly see that the bottom yellow line which is an S&R area that I marked on D TF. So since the previous Weekly Candle shows a reversal candle or rejection candle, and previous DTF candle is a solid bull candle, I am thinking that the bottom yellow line would be a very good place to put in a large buy order. If prices reach this area and I can see a clear pullback on H1 or even Min 5, than this trade has a potential of giving me approximately 70 pips in profit. Which means my SL should be around 20 pips, which falls within my purse of 100 pips SL.
Now my general trade plan for the week on AU has formed. I now go about doing what I need to do and watch the market once every hour.
I know what Bias is most probably going to be, and where to watch out for an entry and finally, if it pans out, where to get out of the trade or do a partial close and move the rest to BE etc etc. Now I just have to see if it pans out.
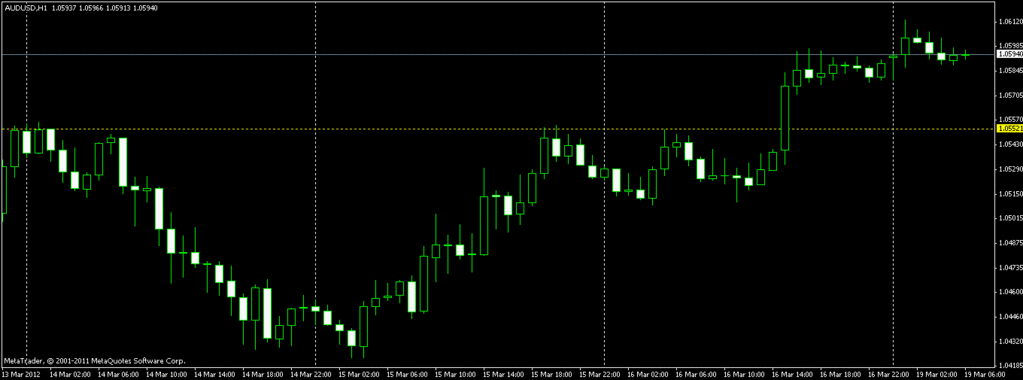
AU H1 TF
Without all the preparation above, looking at a lower TF like H1 will be quite confusing and frustrating because of the many mixed signals/false signals that it produces.
So what happens if price does not pullback to that level I marked, but keeps shooting straight up? Well I dont get an entry. Easy as that.
What happens if it decides to keep shooting down and my take on the market is wrong? Well I dont get an entry. Too bad. My bias reading is a buy. If it becomes a sell I dont get an entry.
So this is what I mean by trying to read the markets. Do not enter when you dont know for sure what its going to do. Take the emotions out. Take the excitement out.
Be prepared and be cool as ice.
Mark your TP levels even before you take the trade. Look at the potential pips, work out whats the Risk to Reward ratio is going to be, so that you wont be caught in a situation where in a rush to take the trade, you find yourself risking 40 pips for 40 pips potential profit. All this is done as preparation long before you take the trade.
Than you only wait. There are no more emotions to deal with as the entry is forming because you have worked it all out and you know what its going to do.
Hope this helps.
Totally agree with you Nikita, you explained the core concept of the trading, thanks for taking time and explained it again.
Sweet another babypips member in my own back yard
If you guys come to London please let me know.
You buy the plane ticket and I am there. Even though I just got back from a vacation I am already due for another one lol.
Bob I will buy a ticket but not now, the day I made 100 k from trading I will contact you. But in the mean time if can come I will be more than happy to meet with you.
well then you need to crank that leverage to the max and starting trading away. I figure you should have 100K in about8 hours time at that rate :16:


