I’m sharing a strategy that I’ve been working on for the last three weeks. It’s actually not a new strategy but rather somewhat of an old one. Credit for inventing the strategy goes to an enigmatic user known as Golden Equity. Although he shared the details of the strategy on a couple of other forums, it has never been exhaustively detailed here.
I wanted to share what I had learned and what I’ve been using in the hopes that others may contribute their observations. I’ve never before shared a strategy in a thread of my own since joining Babypips, so you can imagine that this is a matter of particular interest to me.
[B]Randy Candles[/B]
Chart Setup:
TF - Any, but the most popular are 15m and 5m, with some even using 1m.
Indicators - Although many have tried adding in numerous indicators to act as additional filters (mostly with little or no benefit, in my opinion), the basic Randy Candle setup is simple. One must use Heikin Ashi candles along with 2 Simple Moving Averages – a 25-period SMA (often referred to as the “D” line) and a 3-period SMA. The original strategy also detailed a 7-period SMA but this is not necessarily used to open trades but rather to determine whether a “fan” pattern has occurred or is emerging. All MAs are taken from Closing price.
GE mentioned shifting all SMAs as follows: 25 SMA, shift 5; 3 SMA, shift 3; 7 SMA, shift 5. The purpose of the shift is purportedly to better see the upcoming direction, but I doubt whether the shift is integral to the success of the system.
[B]Theory:[/B]
Heikin Ashi candles can indicate the start of a trend at its earliest point by observation of an indecision candle followed by a strong movement candle. Ordinarily, simply taking a trade off an HA color change or any candle following an indecision candle can be problematic without some kind of filter indicating a new trend is underway or that a present trend is continuing following a retracement. That is the purpose of the SMAs. Additionally, some have reported using stochastics, including multi-timeframe stochs (get to that later).
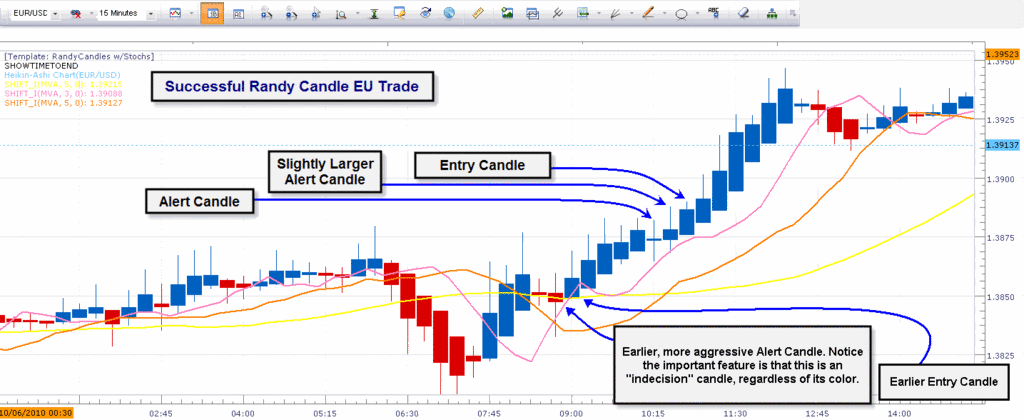
Here is a chart example of what HA indecision candles look like:

The first rule is to look for one of these candles. They are hereafter referred to as Signal or Alert candles. Following a Signal candle, one then looks for a thicker-bodied HA candle with a noticeable wick in the direction of the desired trade. This is your Entry candle and upon its Close your order should then be placed.
[B]Rules:[/B]
The Alert candle –
- The appearance of an Alert Candle is your FILTER.
- Correct alert candles simply have stems ABOVE AND BELOW; they are small to moderate in size.
- The BEST alert candles will CROSS and close OVER the 3 SMA.
- The alert candle is NOT the entry candle! DO NOT ENTER on an alert candle.
- If you enter on an alert candle, you have failed.
The Entry Candle – You must WATCH the entry candle develop to make your decision.
- The Entry Candle must obviously have the right HA color for your direction.
- It must have the correct stem color for your direction…wait till you get it!
- The “preferred” entry candle should only have the stem going your way (not an absolute rule, however).
- The BEST entry candles are birthed having ALREADY crossed the 3 SMA.
- If the above scenario has happened and you are let’s say at the top of a fan you ALREADY have a 90% probability of putting in a correct entry of both timing and direction.
- The SMAs are treated as dynamic points of support and resistance. Dynamic means they move, as opposed to static like Fibos. Support and Resistance means your trades can respect and bounce from them and at other times must “chew” through them. This Price vs. SMA interaction occurs on both the 5M as well as the 15M charts. 3 is the weakest, 25 the strongest. Learn by watching Price vs. the SMAs.
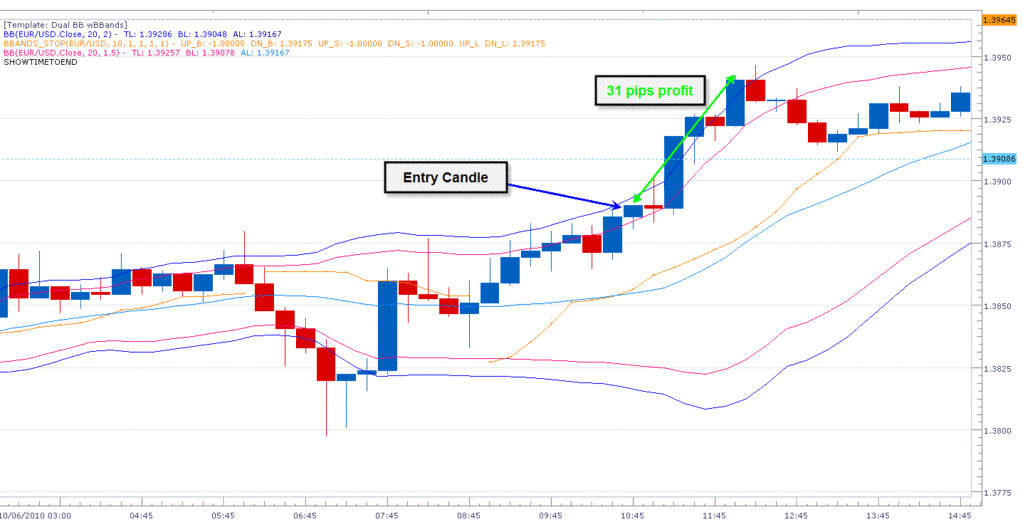
Here is a chart example of a successful Randy Candle trade:

[B]WARNING: SMA Line Arguments[/B]
An SMA Line Argument is when the price is consolidating.
The 3 SMA and 25 SMA start merging and weaving together.
Usually the candles get smaller and color combinations are mixed.
Don’t trade going into one…they can last for hours.

You are looking for a bounce off the 25 SMA or a successful cross of it. You look for your alert candle followed by the entry candle moving away from the D line with the correct HA and stem color for your direction.
In a strong trend, the candles will start respecting the 3 SMA. The best moves will ride above this line.
Exits are a little more complex. I can talk about them later.
Hopes this helps somebody sharpen your entries… You now have a high probability entry signal generated right from the current price action. Probability is all you can expect. It is a discretionary trade method of entry and needs to be tempered with everything else you know about the market.
I’ll cover more in subsequent posts.
John (Merchantprince)
“Nobody can be exactly like me. Even I have trouble doing it.”


