Royal Caribbean Group (RCL) ended the Grand Super Cycle since the all-time lows and corrected the cycle back in 2020. The 03.13.2020 is the beginning of a lesser degree cycle, which is called Super Cycle. The stock should see new all-time highs around the $160-$180 areas. One of the most reliable and popular patterns within the Elliott Wave Theory is the Five wave Impulse. This is basically a sequence of 5-9-13-17-21 waves and always goes with the trend as below chart shows:
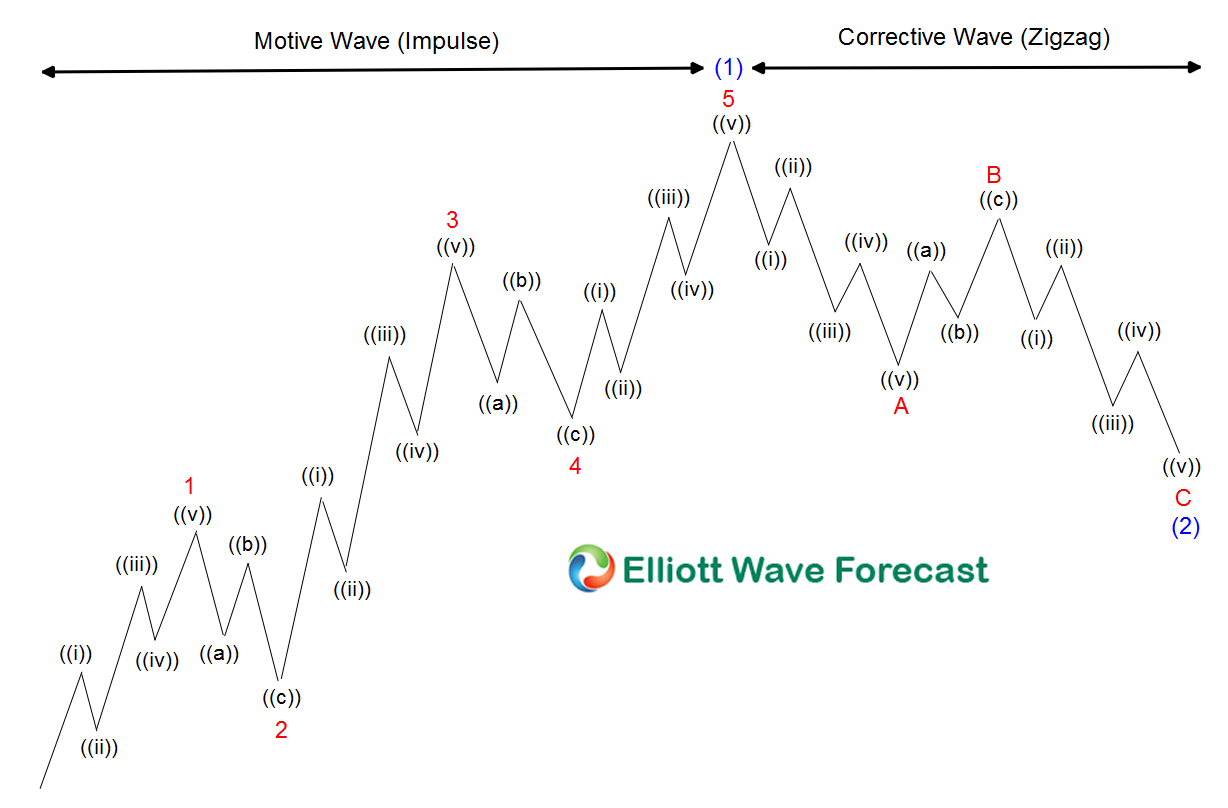
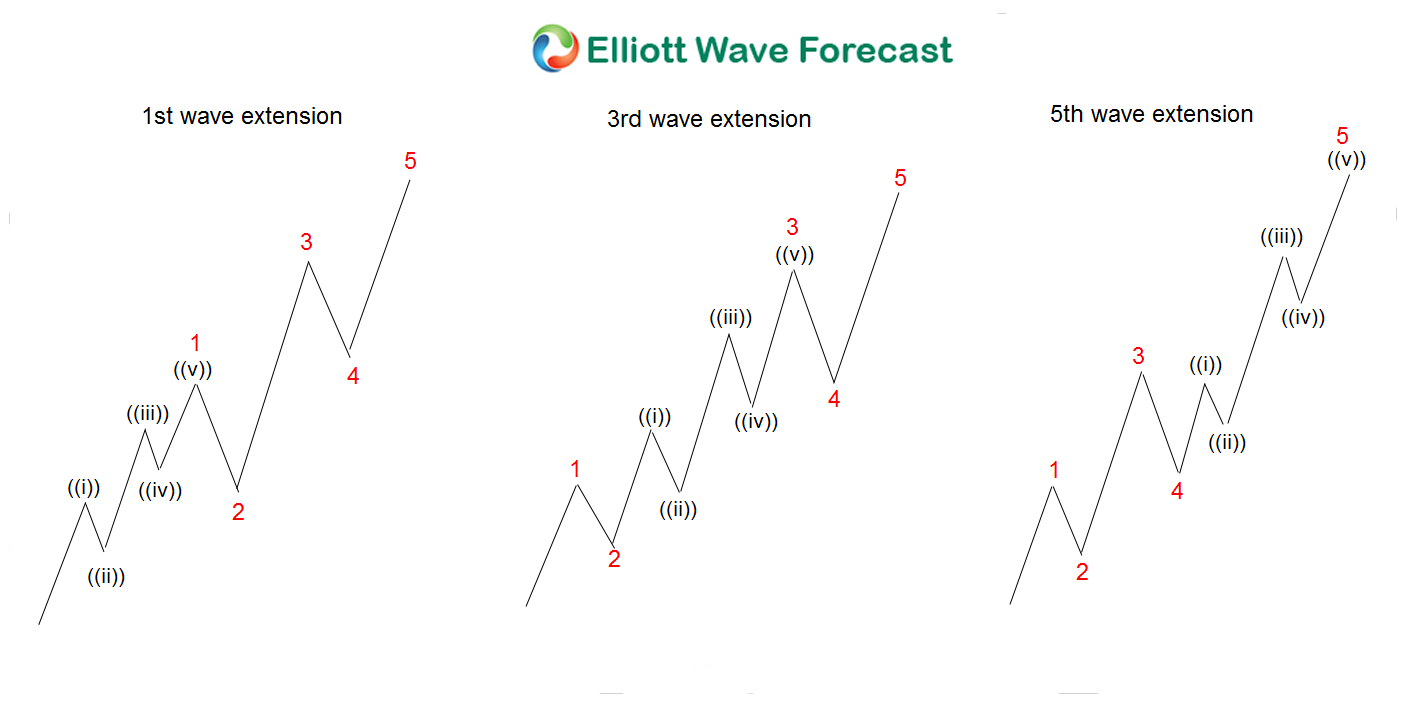
The graphic above shows how the pattern looks like. The five waves move subdivides in lesser degrees which are themselves also five waves. The Elliott Wave Theory’s main principle is that when five waves are in one direction, the market will correct in three, seven, or eleven. Once correction is over, market will follow the previous direction and renew with the five waves. The Following chart shows a 5 waves move with a nest. The concept is a series of five waves until an extension happens within either one of the three impulses; wave 1, wave 3, or wave 5.
RCL Monthly Elliott Wave Chart:
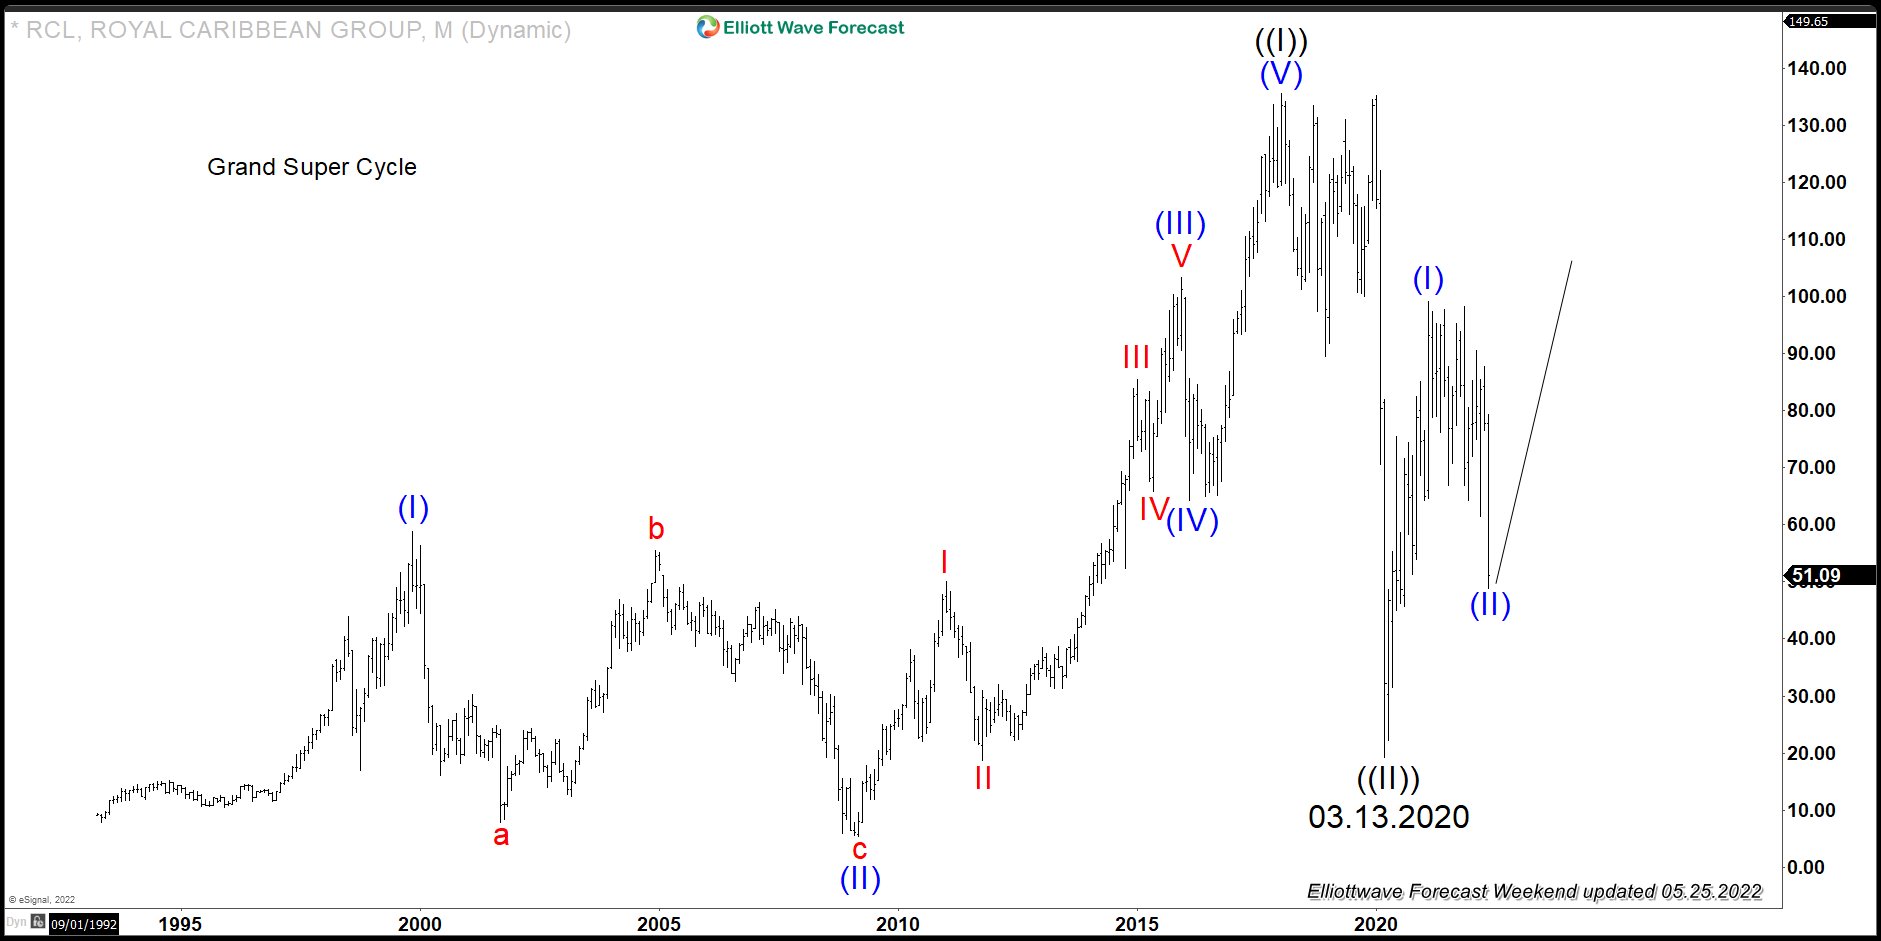
The Monthly chart above shows the Grand Super Cycle for RCL. We can see a nest forming from the all-time lows. It rallied in wave (I) and then wave I before the acceleration happens. Being able to spot a nest is one of the best gifts a trader can have. We believe that the stock can nest again. We can see a higher degree nest from the Grand Super Cycle ((I)), then Super Cycle (I). The pullback in wave (II)) can give a very nice buying opportunity, and we are expecting acceleration to take place soon.
RCL Weekly Elliott Wave Chart
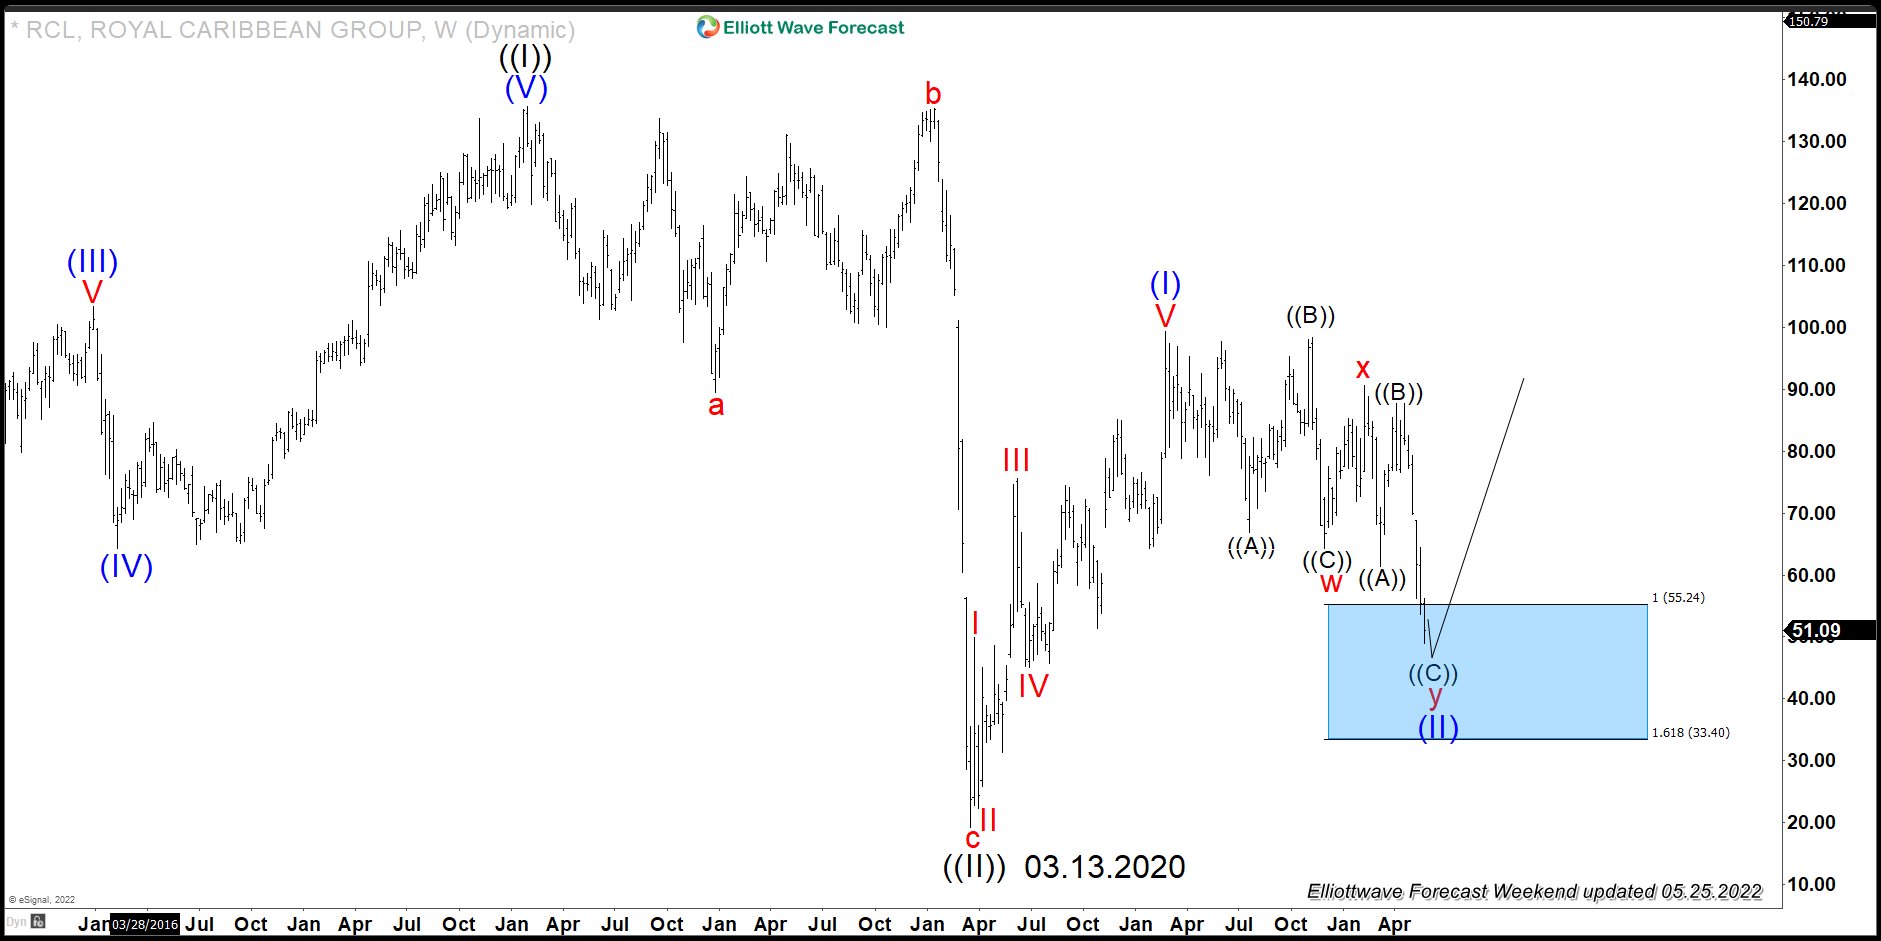
The weekly chart above shows the Super Cycle degree. The stock reacted off the lows at 03.13.2020, and how it is doing a correction against that low. The corrections in the Elliott Wave Theory happens in three, seven, and eleven swing. In this case, we believe a WXY seven swing structure pullback is taking place. The stock reached the area between $55.24-$33.40, and buyers can appear for a huge move higher. The seven swings structure is very clear, and it is important to notice that the first leg into w is in a clear three waves. This rules out an impulse move lower and thus the only alternate view is a flat. In a Flat, we will be ending wave (3) of c, but the odds of that view is very slim at this moment.
In conclusion: The stock is currently trading within buying areas between $55.24-$33.40. A possible nest can take place to the upside. The price action is very clear, and the correction points to a huge acceleration to happen soon.