In the last years, the renminbi made a pause in his attempt to get stronger against USD dollar. On February 2014, renminbi found support at 6.0153 and from there it made a perfect zig – zag correction structure to equal legs at 7.1964 in June 2020. After that, the USDCNH continue with the downtrend.
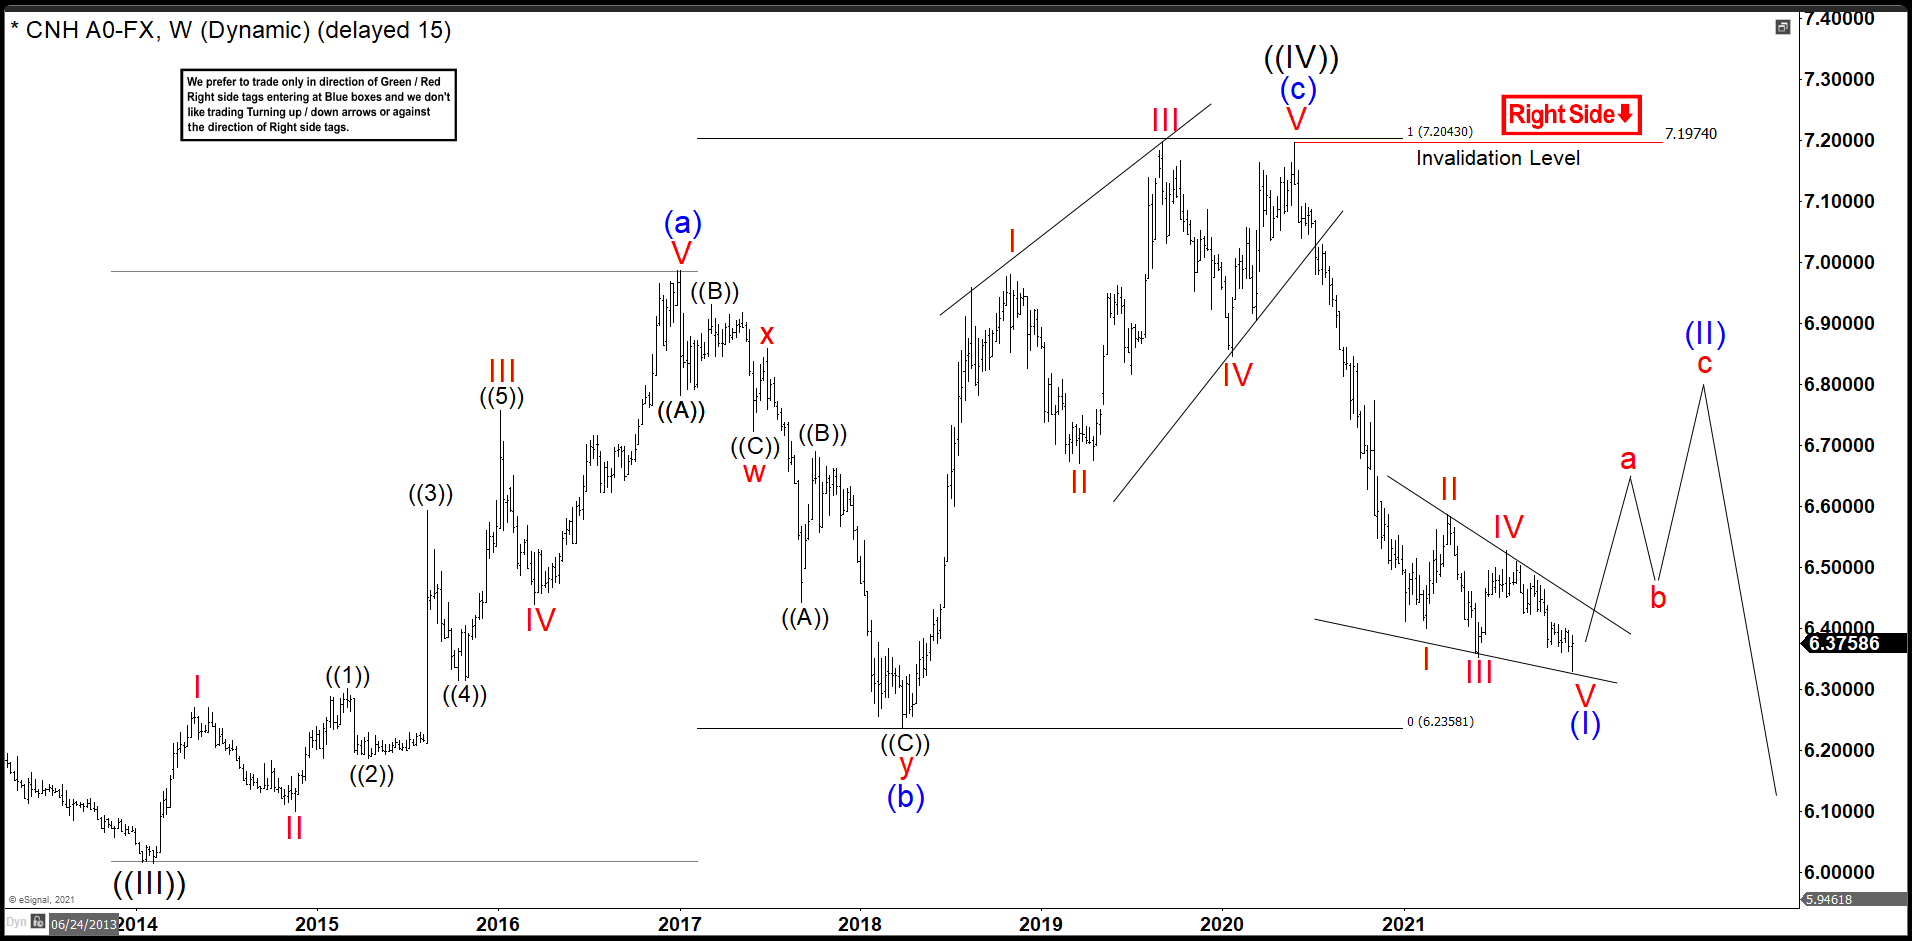
Renminbi December 2021 Weekly Chart
The wave (a) began at 6.0153 and moved high in a 5 waves structure almost hit 7.00 dollars ending at 6.9854. After this 5 waves impulse, we have a huge drop to 6.2359 developing a double correction structure to end wave (b). The volatility did not leave things like that an enormous rally took place in the beginning of wave (c). This movement developed again 5 waves higher, but in this occasion as an ending diagonal structure. Wave (c) finished at 7.1974 reaching the equal leg extension, using Fibonacci tool, taking wave (a) from wave (b) to get wave (c) at 100% Fibonacci extension.
This zig zag structure took place as wave ((IV)), it is telling us that the renminbi should appreciate against the USD in long term. In June 2020, the pair dropped again possibly doing a leading diagonal, that was the pattern we drew in the chart. If that structure played out we should see a bounce before continue with downtrend. (If you want to learn more about Elliott Wave Theory, please follow these links: Elliott Wave Education and Elliott Wave Theory).
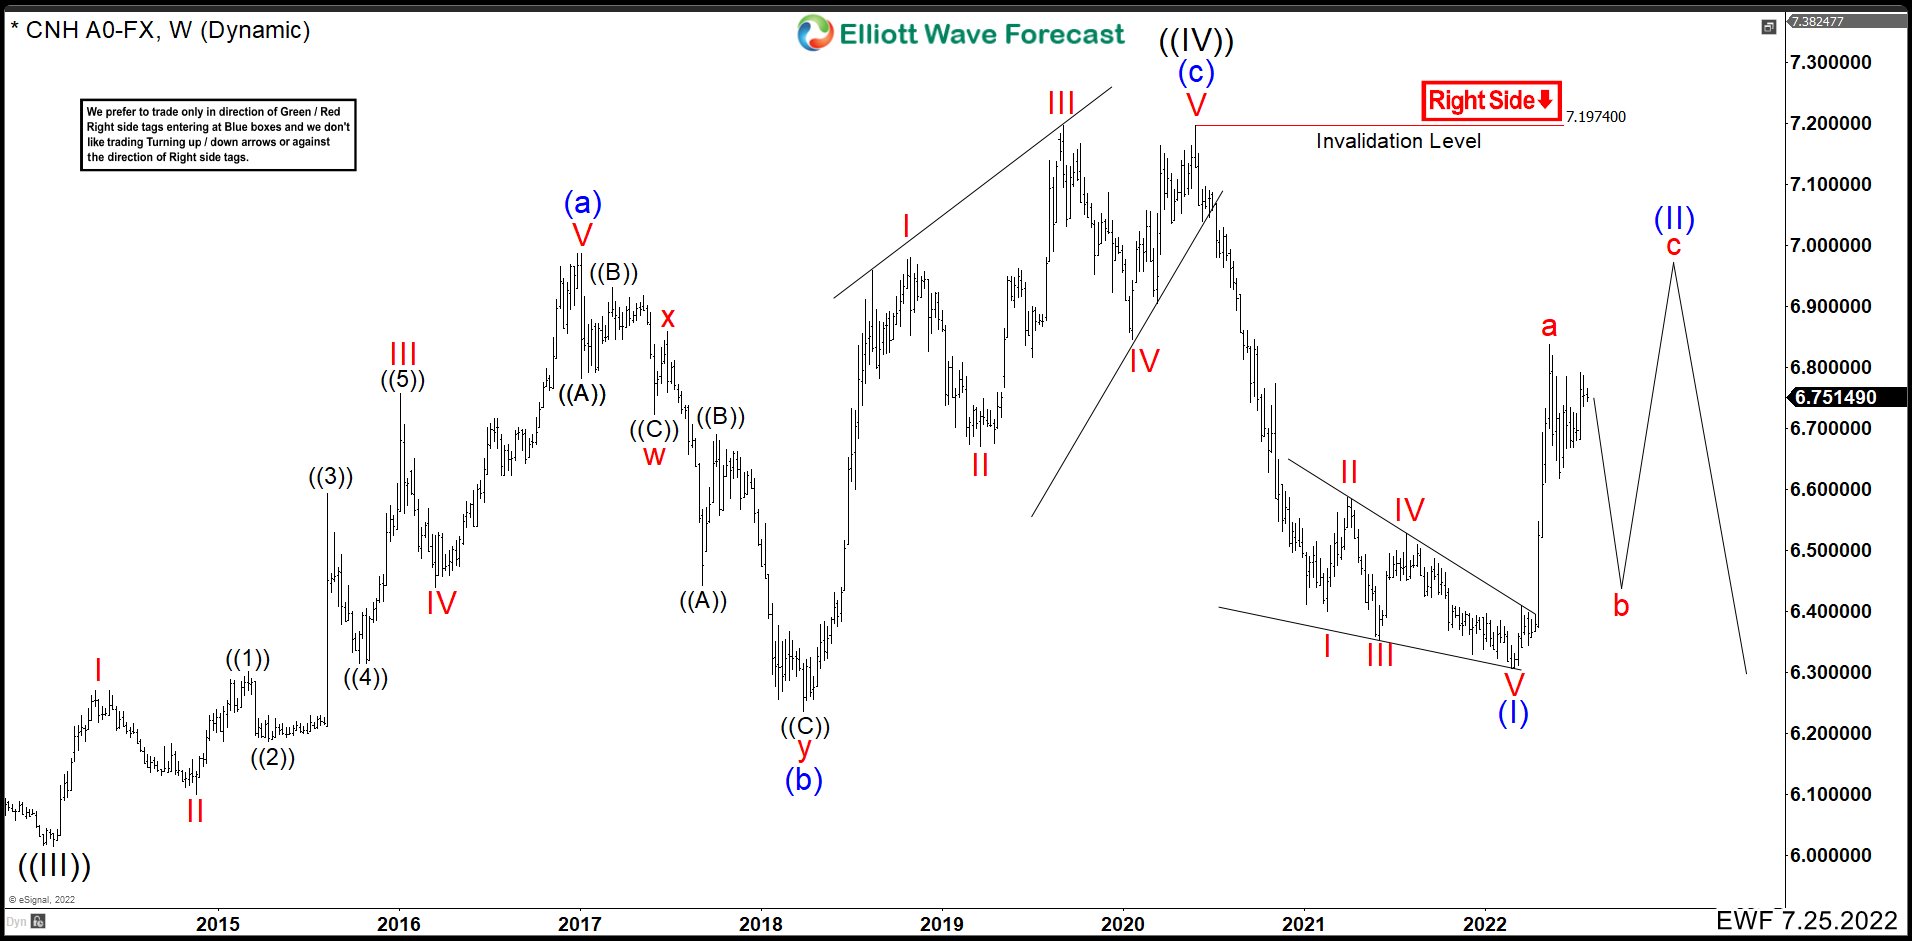
Renminbi July 2022 Weekly Chart
After six months, we could see that the leading diagonal played out bouncing hard from 6.3052 where we called wave (I) ended. This move higher looks like an impulse and we labeled as wave a ended at 6.8387. We need at least 3 swings to complete a corrective pattern as wave (II); therefore, we are calling a drop to complete a wave b and then higher again above 6.8387 to end wave c fo (II) and turning lower again.
Only a break lower of 6.3052 level will confirm that wave (II) is completed and the bearish trend will continue. For long term traders the USDCNH, certainly, must break 6.0153 in sometime.

