We recently got a good buying opportunity in RTY_F (Russell Futures) and members who bought in the blue box are already enjoying a risk free position. Our members know Index futures is in an Elliott wave impulse structure since March 2020 low with wave ((5)) in progress. Within this wave ((5)), it ended a minor wave 2 on September 20, 2021 and Minute degree wave ((ii)) on October 1, 2021. It ended wave (iii) of ((iii)) at 2460.80 on November 8, 2021 and started pulling back in wave (iv). Wave (iv) pull back unfolded as a double three Elliott wave structure and found buyers in the blue box as expected. In this technical blog we’re going to take a quick look at the charts of Russell futures published in members area of the website and explain the Elliott Wave structure and trading strategy.
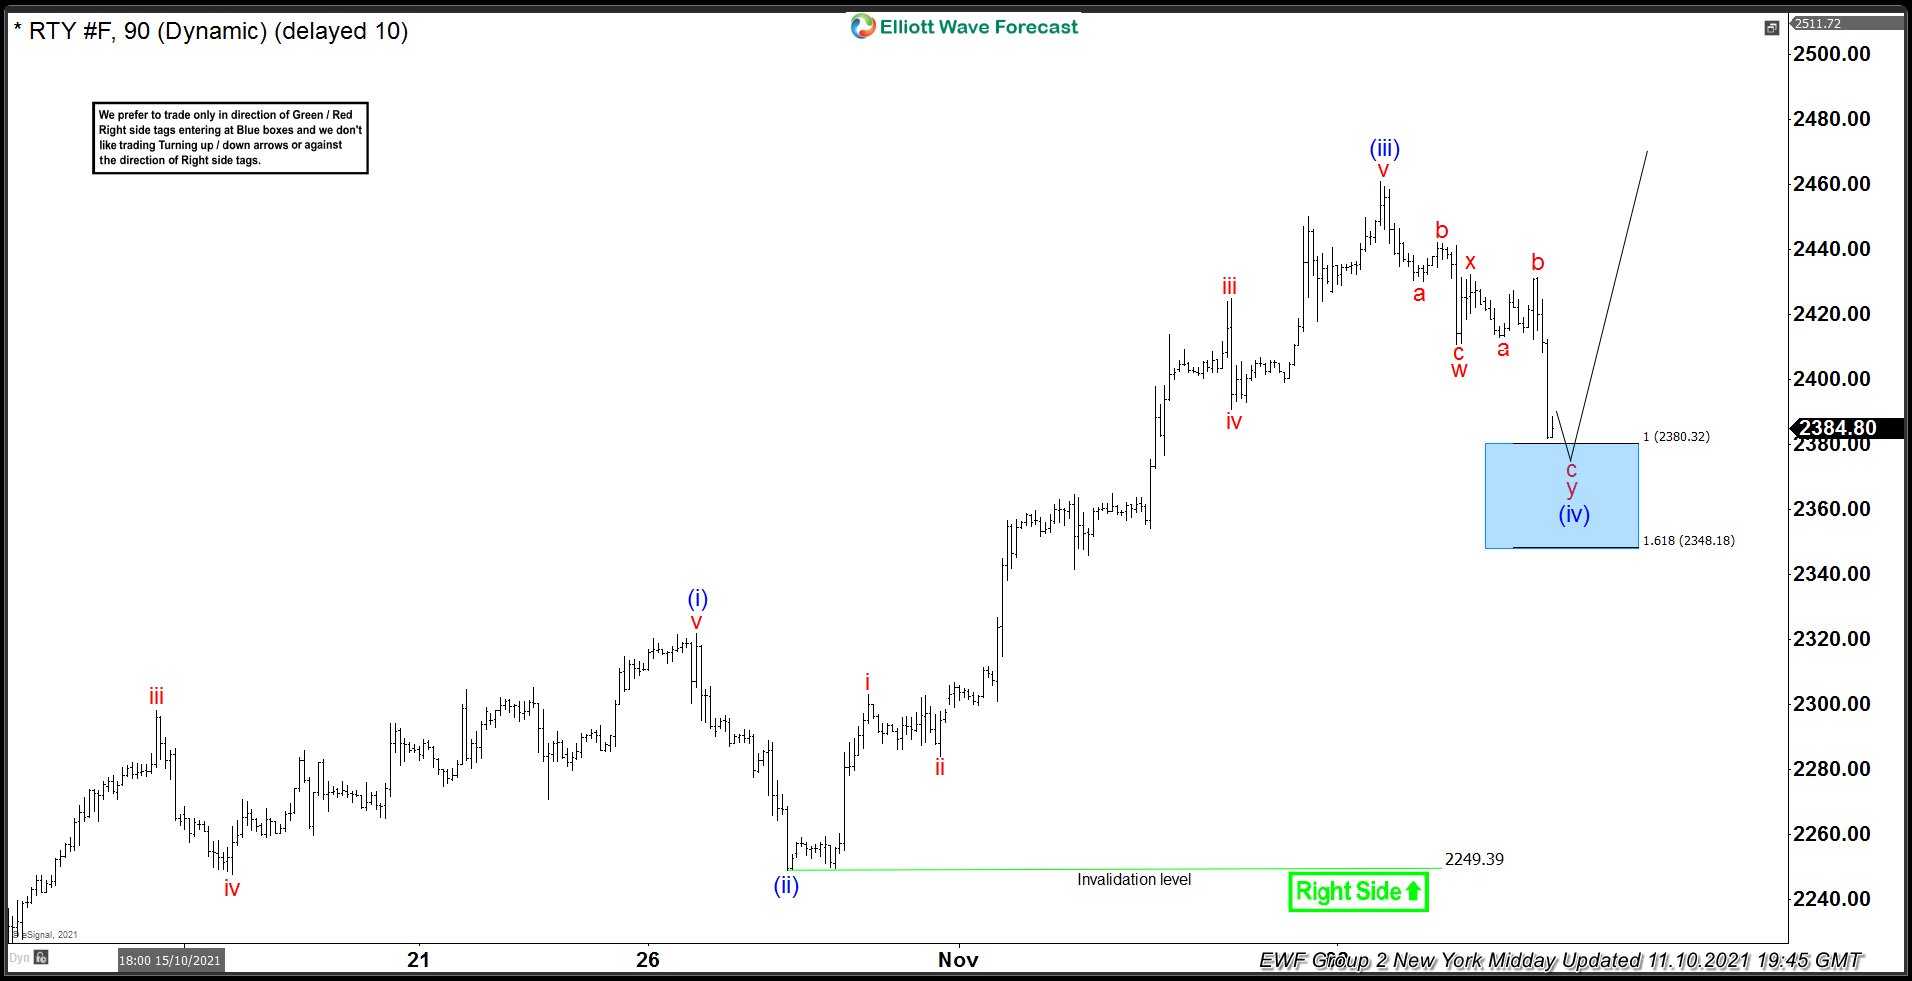
RTY_F 10 November 1 Hour Elliott Wave Analysis
Chart below shows RTY_F wave (i) completed at 2321.90, wave (ii) completed at 2249.39 and wave (iii) completed at 2460.80. Wave (iv) pull back is unfolding as a double three structure within which wave “w” completed at 2410.90, wave “x” completed at 2432.20, wave “y” is in progress and is expected to complete between 2380.32 - 2348.18 to complete wave (iv). We expect buyers to appear in the blue box to resume the rally in wave (v) or produce a reaction higher in 3 waves at least.
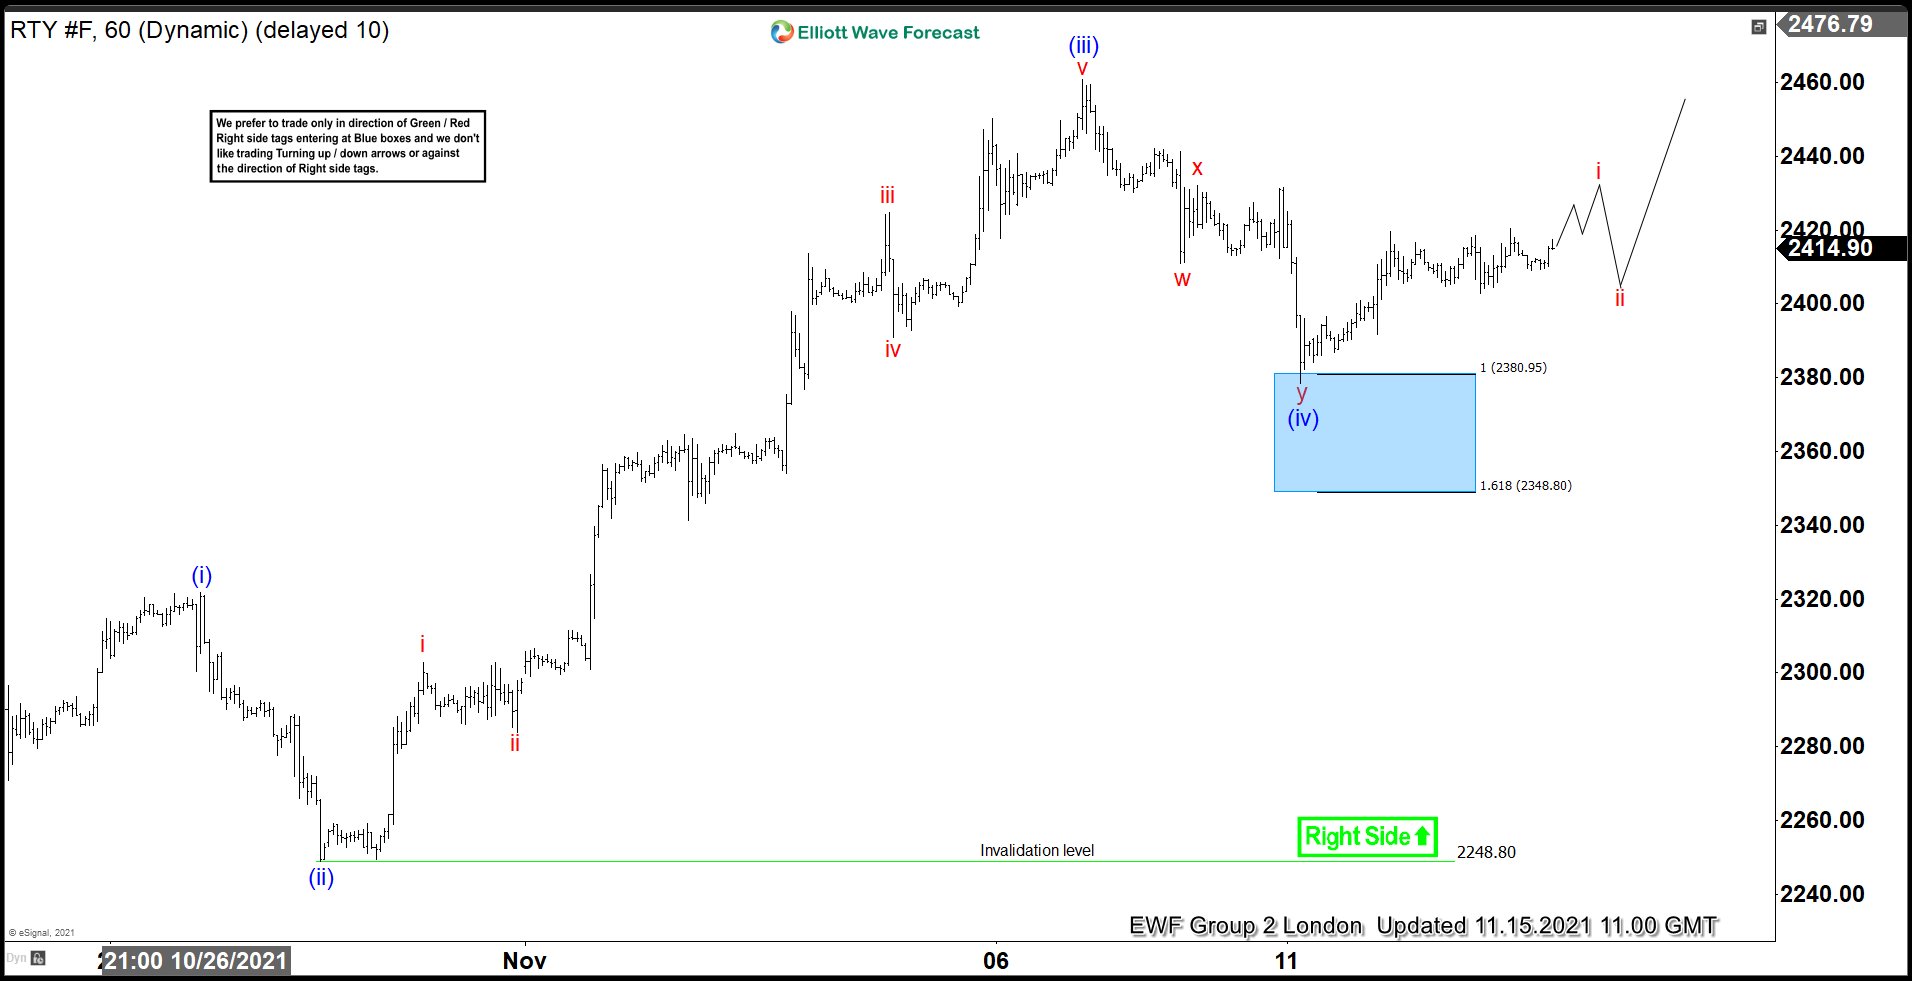
RTY_F 15 November 1 Hour Elliott Wave Analysis
Chart below shows cycle from wave (iii) peak completed at 2378.40 which we have labelled as wave (iv) and we saw a reaction higher from the blue box after buyers appeared. We already reached 50% Fibonacci retracement of the decline from red “x” peak so members who bought in the blue box are already risk free. As pull backs hold above 2378.40, we expect continuation higher in wave (v) towards 2480.24 - 2511.67 which is the inverse 1.236 - 1.618 Fibonacci extension area. Failure to break above wave (iii) peak and a break below 2378.40 will suggest 2460.80 peak was black wave ((iii)) and we are doing a double correction in wave ((iv)) and we should still see buyers at the next extreme blue box area.
You can learn more about Elliott Wave Theory and Patterns at our Free Elliott Wave Educational Web Page .
Source: RTY_F : Buying Dips In Blue Box After Double Three Correction