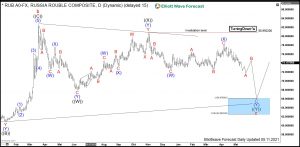
Back in December 2020, we presented within the main article both the monthly and the daily view in the USDRUB. Long-term, the pair should provide a resolution thrust higher out of multi-year triangle pattern. Medium-term, however, we saw Russian Rouble gaining strength as related to the US Dollar. Even though russian currency needed to tank, the idea favoring more Rouble strength remains the same. Here, we present updated daily chart and discuss the targets.
Rouble Daily Elliott Wave Analysis 05.11.2021
The daily chart below shows the c leg lower of the triangle in wave (IV) in more detail. From the March 2020 highs at 82.90, the pair has demonstrated a first leg lower which has accomplished 7 swings corrective structure in wave ((W)). Then, a bounce in wave ((X)) has failed below the March 2020 peak. Currently, while below 80.95, another leg down is in progress. It should develop a corrective structure and reach in wave ((Y)) towards 66.07-56.87 area. There, it should find support for a bounce in red wave d higher. Otherwise, in case of breaking below 56.87 level, the triangle pattern in wave (IV) will need a reevaluation.
Within wave ((Y)), waves (W) and (X) have ended. Now, while below the April 4th peak at 78.05, wave (Y) of ((Y)) might be already in progress and we see it within the red wave A of (Y). One of the reasons favoring more downside in USDRUB is the expanded flat structure within wave (X). In fact, it is a continuation pattern. Therefore, another leg lower similar to the cycle in blue wave (W) of ((Y)) should take place.
As an outlook, decline towards 66.07-56.87 area signifies the medium term Rouble strength. Therefore, traders can be looking to sell the bounces against 78.05 peak in 3, 7 or 11 swings until USDRUB will not not reach at least 66.07 level. However, long term favors still the dominance of the Dollar over the currency of the Russian federation. Indeed, the larger cycle from 2008 looks still incomplete and 85.94 highs should still be reached in a longer run.
