Alright finally my week of utter destruction of my account has come to an end. I even felt compelled not to post these trades because of how poorly I did. Not only for taking trades that I probably shouldn’t have but also the complete failure I had. I definitely think they are linked. But I am going to study up this weekend and come out firing like I always do. I don’t take losers lightly, considering how much i have learned with such a small amount of money I should be thankful. But its the personal hit that my progress has not proven fruitful even though I study hard everyday that hurts the most. I have reached my first plateau, the ground floor. Lets see if i can even make it one step up the hill next week. We actually started off Friday with some winners which was hopeful, but then I started to take trades there were lacking.
EUR/GBP
Price:.87841 SL:.8804 TP:.8734 Closed at trailing stop @.87575

This trade actually was a great one. I should have just let the trade run instead of trying to lock in profits. Probably due to fear from previous losses. We hit a daily supply zone where we were before. But since we didn’t penetrate it that deeply and another hourly level was created under it I thought I should take it. This is what one of my trades SHOULD look like. It was during the large upswing i got nervous, I should have just let it run and made my entire TP.
Net: 26.6 pips
USD/CAD
Price:1.0270 SL:1.02874 TP:1.0240 Closed at 1.02516

Here was a 15 minute level. Actually according to my MT4 we gapped down which was amazing for me. We are ranging inside what i would consider long term supply giving me a sell bias. Which worked out amazingly. Again I closed very close to my TP. I was trailing my stop right above the 5 minute candles. During these really whipsaw areas I was playing straight up defense. If there is any slow down in the momentum of these short term trades I am looking for an exit immediately.
Net:18.4
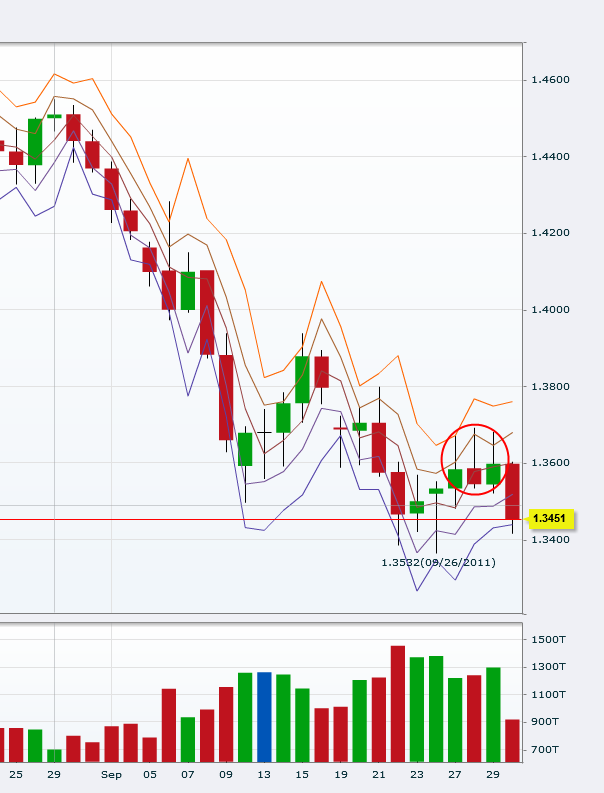
EUR/USD
Price:1.35471 SL:1.35632 TP:1.35168 Closed @ 1.35467

Perfect example of shooting myself in the foot by moving my SL to BE immediately. Would have made quite a lot of pips on this one if i had stayed in and not been so hurried to get out. 15 min level again.
Net: 0
GBP/USD
Price:1.54301 SL:1.54119 TP:1.54601 Closed at 1.54242

SO this time closing early saved my butt. Ah the conundrum of trading somethings help you sometimes some things hurt you sometimes. Its so hard to find which one has the highest chance of helping you MOST of the time. I took the Rally base Rally level here, should have waited for the rally base drop. This is where i start to fall apart.
Net: -5.9 pips
Same level again I take it, on the candle after the pinbar looking for it to go up, using the pinbar as price confirmation.
Price:1.54342 SL:1.54023 CLosed at SL @ 1.54173
We had 1 pip slippage which sucked again with Oanda having some problems. Though 1 pip isnt so bad. Atleast I got out.
Net-16.9 pips


 but if it was a loser i wouldn’t feel that way. Demand 1 has been pierced over 50% so i will not be taking a trade there.